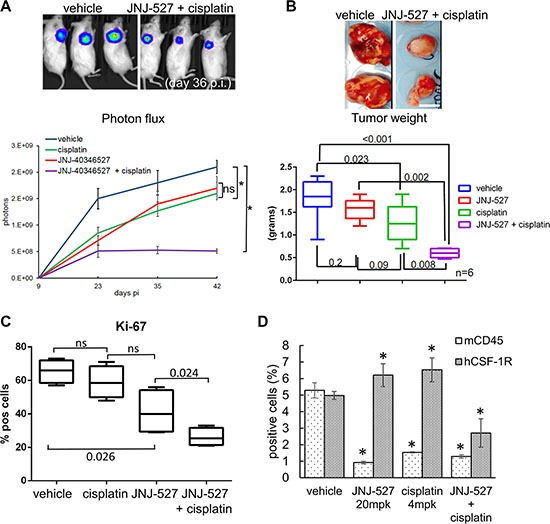
Figure 4. CSF-1R inhibition affects tumor growth.

(A) Upper panel. Representative micrographs. D-Luciferin (150 mg/kg) was injected intraperitoneally and anesthetized mice were imaged at day 36 after cell injection (p.i). Lower panel. Graph reporting the averaged photons emitted in time (day 9, 23, 35, 42 p.i.) for each group. Average ± SE reported for each group.*p < 0.05. (B) Upper panel Representative micrographs of the tumors excised at day 42 p.i. from vehicle-(left panel) and cisplatin+ JNJ-40346527 (right panel) -treated mice. Scale bar: 10 millimeters. Lower panel. Graph reporting the dry tumor weight of the excised tumors at day 38 p.i from all of the groups. Mean ± SE for each group of mice is reported. p-values are reported for each paired group. (C) The CSF-1R TKI affects the proliferation of the treated tumors. Left panel. Single cells obtained from the disaggregated and pooled tumors were cytospun and stained with an anti-Ki67 antibody. Histograms showing the mean ± SE of Ki-67pos cells for each group of treatment. (D) Target engagement in the JNJ-40346527 treated tumors. The CSF-1R TKI targets both human CSF-1Rpos cell and murine CD45pos cells. Histogram reporting the percentage of human CSF-1Rpos cells and the percentage of murine CD45pos cells as assessed by FACS staining of the disaggregated tumors. Mean ± SE for each group of mice is reported.
