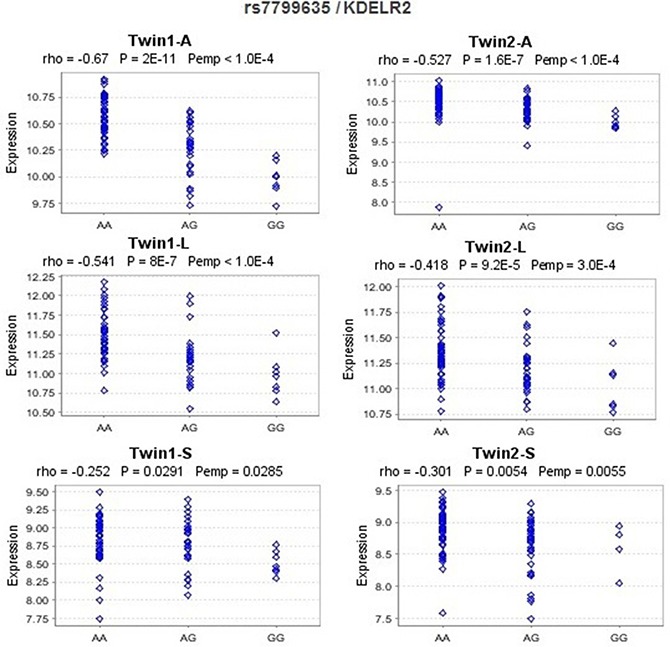
Figure 3. eQTL analysis for rs7799635 and KDELR2 in the MuTHER pilot study.

A, L, and S are short for adipose tissue, lymphoblastoid cell line, and skin tissue, respectively, from MuTHER healthy female twins. Rho: Spearman correlation coefficient; P: P-values of Spearman correlation test; Pemp: empirical P-values calculated from 10,000 permutations. The figures were downloaded from Genevar.
