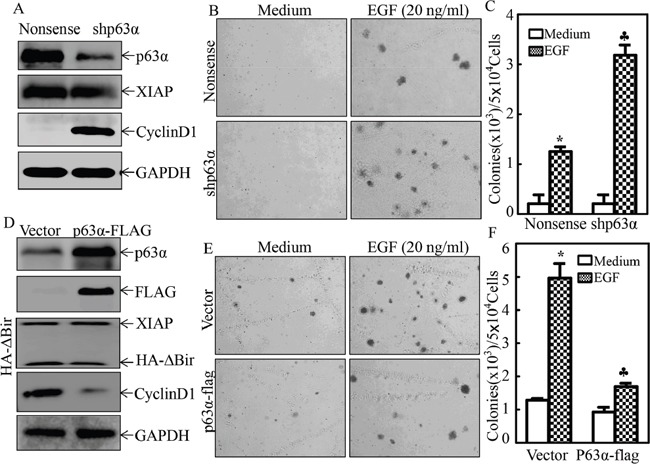
Figure 3. p63α inhibited EGF-induced malignant transformation of human bladder epithelial cells.

A. The cell extracts of UROtsa(Nonsense) and UROtsa(shp63α) transfectants were subjected to Western blot as indicated for identification of knockdown efficiency of shRNA targeting p63α. B. and C. UROtsa(Nonsense) and UROtsa(shp63α) transfectants were subjected to anchorage-independent growth in the presence or absence of EGF as indicated. Representative images of the colonies of indicated cells were captured under microscopy following 3 week incubation period (B); the number of colonies was counted under microscopy and the results were presented as colonies per 50,000 cells from three independent experiments. The asterisk (*) indicates a significant increase as compared with medium control, and the symbol (♣) indicates a significant increase in comparison to UROtsa(Nonsense) cells (p<0.05) (C). D. Western blot was used to identify the stable overexpression level of p63α-Flag in UROtsa(HA-ΔBIR) cells in comparison to UROtsa(HA-ΔBIR/Vector) control cells; E. and F. UROtsa(HA-ΔBIR/Vector) and UROtsa(HA-ΔBIR/p63α-FLAG) cells were subjected to anchorage-independent growth in the presence or absence of EGF as indicated. Representative images of the colonies of indicated cells were captured under microscopy following 3 week incubation period (E); the number of colonies was counted under microscopy and the results were presented as colonies per 50,000 cells from three independent experiments. The asterisk (*) indicates a significant increase as compared with the medium control, and the symbol (♣) indicates a significant inhibition in comparison to UROtsa(HA-ΔBIR/Vector) cells (p<0.05) (F).
