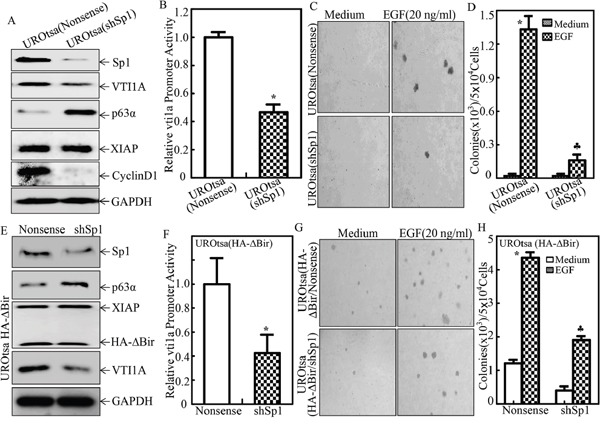
Figure 9. Sp1 was crucial for VTI1A transcription, p63α expression and EGF-induced malignant transformation of human bladder epithelial cells.

A. The cell extracts obtained from UROtsa(Nonsense), and UROtsa(shSp1) were subjected to Western Blot for determination of expression of protein expression as indicated; B. UROtsa(Nonsense) and UROtsa(shSp1) were co-transfected with VTI1A promoter-driven luciferase reporter and pRL-TK. Twenty-four hours post transfection, the transfectants were extracted to evaluate the luciferase activity, with normalization to TK. The results were presented as luciferase activity relative to nonsense control transfectant. Each bar indicates mean±SD from three independent experiments. The symbol (*) shows a significant decrease as compared to UROtsa(Nonsense) cells (P<0.05); C. and D. UROtsa(Nonsense) and UROtsa(shSp1) were subjected to anchorage-independent growth in the presence or absence of EGF as indicated. Representative images of the colonies of indicated cells were captured under microscopy following 3 week incubation period (C); the number of colonies was counted under microscopy and the results were presented as colonies per 50,000 cells from three independent experiments. The asterisk (*) indicates a significant decrease as compared with the medium control, and the symbol (♣) indicates a significant inhibition in comparison to UROtsa(Nonsense) cells (p<0.05) (D). E. The cell extracts obtained from UROtsa(HA-ΔBIR/Nonsense), and UROtsa(HA-ΔBIR/shSp1) were subjected to Western Blot to determine expression of protein expression as indicated; F. UROtsa(HA-ΔBIR/Nonsense) and UROtsa(HA-ΔBIR/shSp1) were co-transfected with vti1a promoter-driven luciferase reporter and pRL-TK. Twenty-four hours post transfection, the transfectants were extracted to evaluate the luciferase activity, with normalization to TK. The results were presented as luciferase activity relative to nonsense control transfectant. Each bar indicates mean±SD from three independent experiments. The symbol (*) shows a significant decrease as compared to UROtsa(HA-ΔBir/Nonsense) cells (P<0.05); G. and H. UROtsa(HA-ΔBIR/Nonsense) and UROtsa(HA-ΔBIR/shSp1) were subjected to anchorage-independent growth in presence or absence of EGF as indicated. Representative images of colonies of indicated cells were captured under microscopy following 3 week incubation period (G); the number of colonies was counted under microscopy and the results were presented as colonies per 50,000 cells from three independent experiments. The asterisk (*) indicates a significant decrease as compared with the medium control, and the symbol (♣) indicates a significant inhibition in comparison to UROtsa(HA-ΔBIR/Nonsense) cells (p<0.05).
