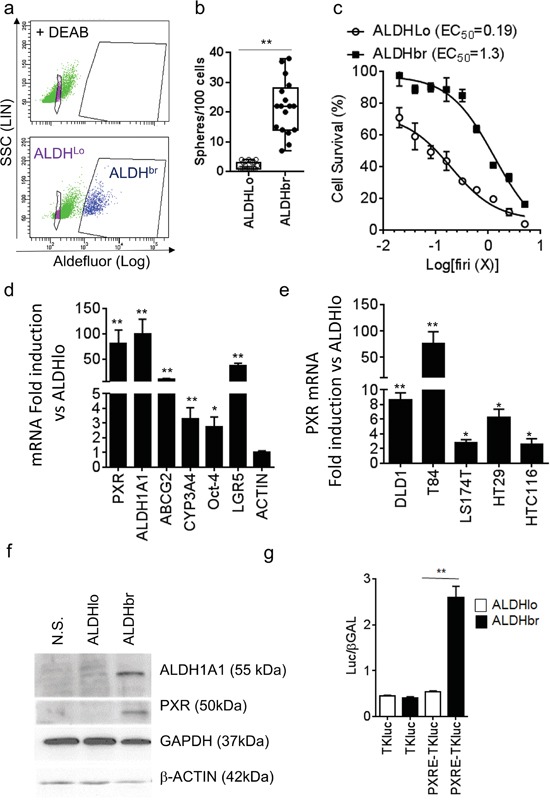
Figure 2. PXR expression is increased in colorectal ALDHbr CSCs.

a. Aldefluor assay and gates used for CRC1 cell-sorting. The ALDH inhibitor DEAB was added to identify ALDH-positive (ALDHbr) cells. b. Percentage of sphere-forming cells of the ALDHbr and ALDHlo populations. c. Percentage of surviving cells, 72 hours after exposure of ALDHbr and ALDHlo cells to the indicated concentrations of Firi (1X=50μM 5-FU + 500nM SN38). Data are expressed as mean ± SEM of 3 experiments, and half maximal effective concentrations (EC50) are indicated. d. RT-qPCR analyses of mRNA expression for PXR, PXR targets and CSC marker genes in the ALDHbr compared to the ALDHlo population (F.I., Fold Induction). e. RT-qPCR quantification of PXR mRNA in ALDHbr and ALDHlo cells from CRC cell lines. d,e: Data are expressed as mean ± SEM (n=3) and reported as fold change compared to ALDHlo cells. f. ALDH1A1, PXR, GAPDH and β-ACTIN protein expression in unsorted (NS), ALDHlo and ALDHbr CRC1 cells. g. PXR transcriptional activity was determined in ALDHlo and ALDHbr CRC1 cells 24 hours after transfection with luciferase reporter plasmids. Data are expressed as mean ± SEM (n=3) of luciferase/β-Galactosidase ratio. *, p<0.05; **, p<0.005.
