
Figure 4. PXR regulates a large network of key CSC chemoresistance genes.
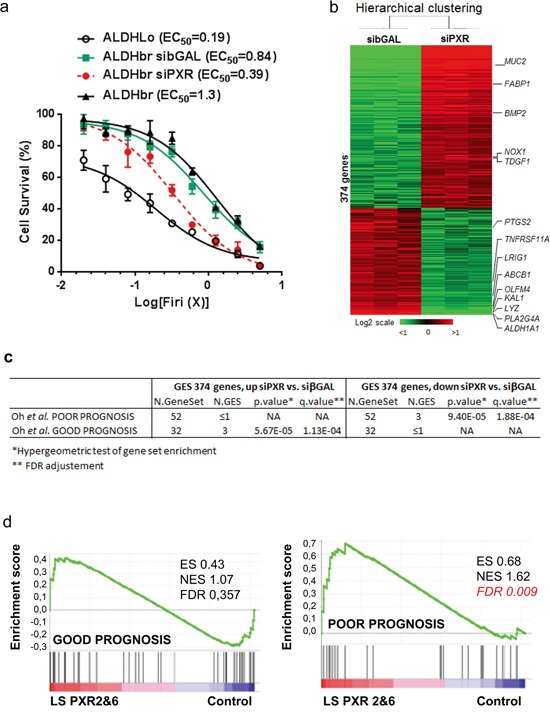
a. Percentage of surviving cells, 48 hours after exposure of cells to the indicated concentrations of Firi (1X=50μM 5-FU + 500nM SN38). ALDHbr CRC1 cells were first transfected with or without 100nM of control (siβGAL) or PXR-specific (siPXR-1334) siRNA. Data are expressed as mean ± SEM (n=3). b. Hierarchical clustering of 6 samples and 374 genes, differentially expressed between PXR siRNA (siPXR) and control siβGAL-transfected ALDHbr CRC1 cells. Each row represents a gene and each column represents a sample. c,d. Gene set enrichment analyses (GSEA) were used to interrogate the similarity of genes that were differentially expressed in the microarray experiments after loss- (c) or gain-of PXR (d) function, to signatures of patient prognosis (Oh, S.C., et al. Gut 61, 1291-1298 (2012)). c: genes induced by siRNA-mediated PXR depletion in ALDHbr cells “Up siPXR vs. siβGAL” or decreased by PXR depletion “Down siPXR vs. siβGAL”. d: PXR-overexpressing LS174T clones 2&6 versus LS174T control.