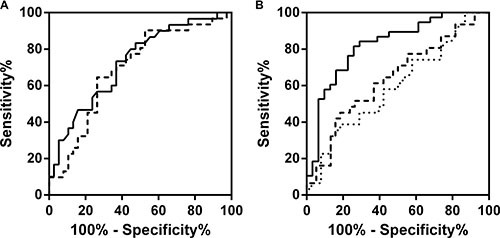
Figure 3.

(A) Receiver-operator characteristic (ROC) curve of the predicted probability of detecting cancers of Gleason score ≥ 7 on biopsy by urinary PSA-PhoSL (solid curve) and urinary PSA-AAL (dashed curve). (B) ROC curve of the predicted probability of detecting cancers of Gleason score ≥ 7 on biopsy by the optimum logistic regression model (solid curve), serum PSA (dotted curve), and PSA density (dashed curve).
