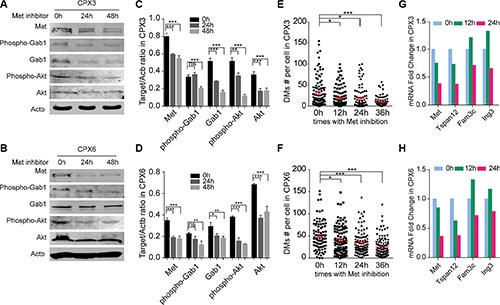
Figure 4. Met inhibition caused a loss in DMs.

Western blot results show effective inhibition in CPX3 (A) and CPX6 (B) for 24 and 48 hours with 4 × 10⁻⁴ μg/ml Met inhibitor treatment. Quantification data are shown in (C) (CPX3) and (D) (CPX6), n = 3. Scatter plot show a significant decrease in the DMs population 12, 24, and 36 hours with Met inhibition in (E) CPX3 and (F) CPX6, for each group, n = 100 from three independent studies. Quantitative real-time PCR results show decreased expression levels of DMs-carrying genes with Met inhibition in (G) CPX3 and (H) CPX6. A two-tailed student's t-test was employed as statistics; *P < 0.05, **P < 0.01, ***P < 0.001.
