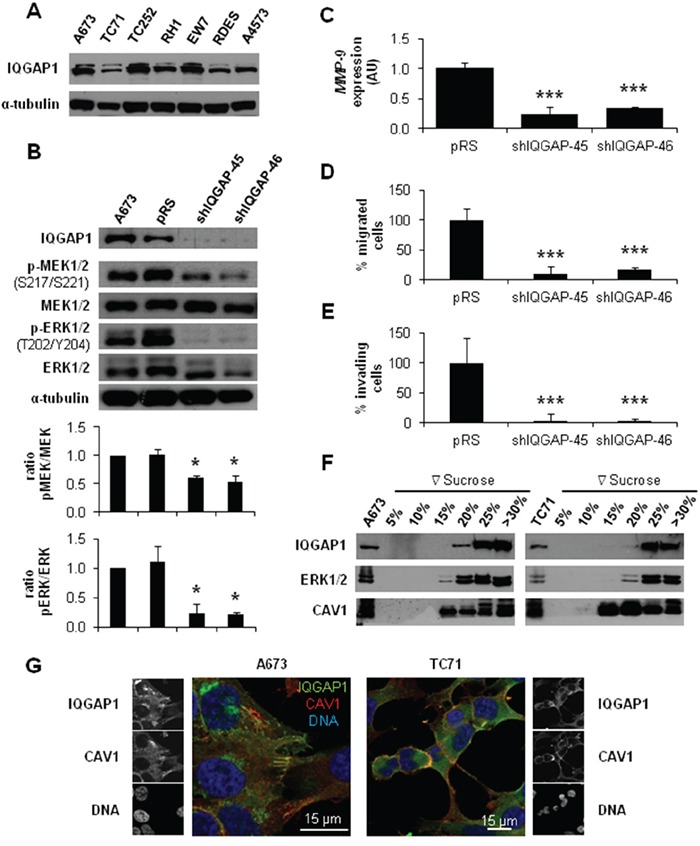
Figure 3. IQGAP1 intermediates in CAV1-regulation of migratory and invasive capacity of ES cells.

A. Representative western blot showing the expression levels of IQGAP1 in different ES cell lines. B. Representative blots of MEK1/2 and ERK1/2, either total or phosphorylated, in IQGAP1-interfered cells. α-tubulin was used as loading control in every panel. Quantification of the phosphorylated vs. total ratios is shown below each set of blots C. Quantitative real time RT-PCR showing MMP-9 levels (β-Actin as reference) in A673 shIQGAP1 model. D. Quantification of the transwell migratory capacity in A673 IQGAP1-interfered cells. E. Quantification of the matrigel-coated transwell invasive capacity in A673 IQGAP1-silenced model. F. Western blot of IQGAP1, ERK1/2 and CAV1 in sucrose gradient separation phases from A673 (left) and TC71 (right) cell lines. G. Confocal imaging showing IQGAP1 (green) and CAV1 (red) in A673 (left) and TC71 (right) cell lines. Scale bar 15 μm. Statistical significance was achieved by the Student's t test: *p≤0.05 **p≤0.001 ***p≤0.0001.
