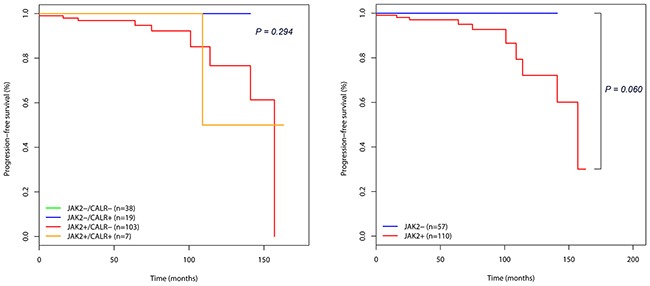
Figure 2. Kaplan-Meier survival curves showing the progression-free survival (PFS) in 167 essential thrombocythemia (ET) patients according to mutational status.

A. PFS categorized according to the mutational status of JAK2 and CALR. The survival line of JAK2-/CALR- group (green) was hidden in the back of that of JAK2-/CALR+ group (blue). B. PFS categorized according to the mutational status of JAK2.
