
Figure 8. Immunofluorescent labelling for galectin-1 and α-SMA in liver samples.
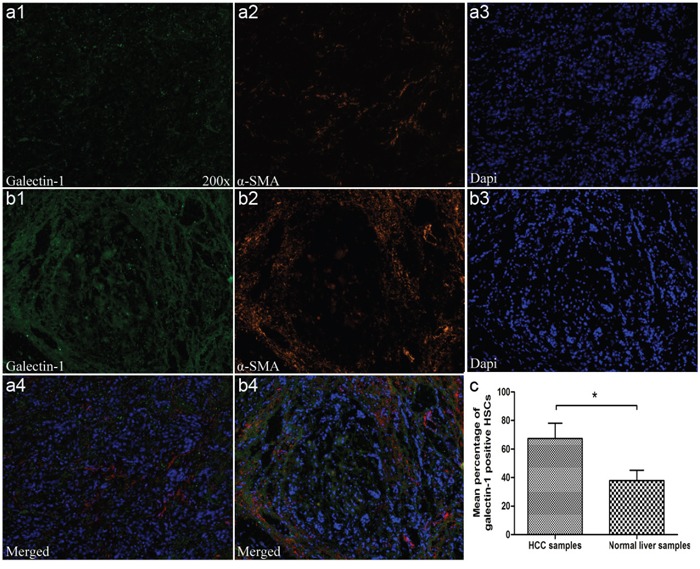
A1-A4. α-SMA and galectin-1 levels in normal liver samples (n = 12) and B1-B4. HCC (n = 31) by immunofluorescence. C. Levels of HSC-derived galectin-1 assessed by evaluating the number of galectin-1-positive hepatic stellate cells (both positive for galectin-1 and α-SMA) over the total number of HSCs (only positive for α-SMA). Data are shown as the means (± SD). Magnification: ×100. *P < 0.05.