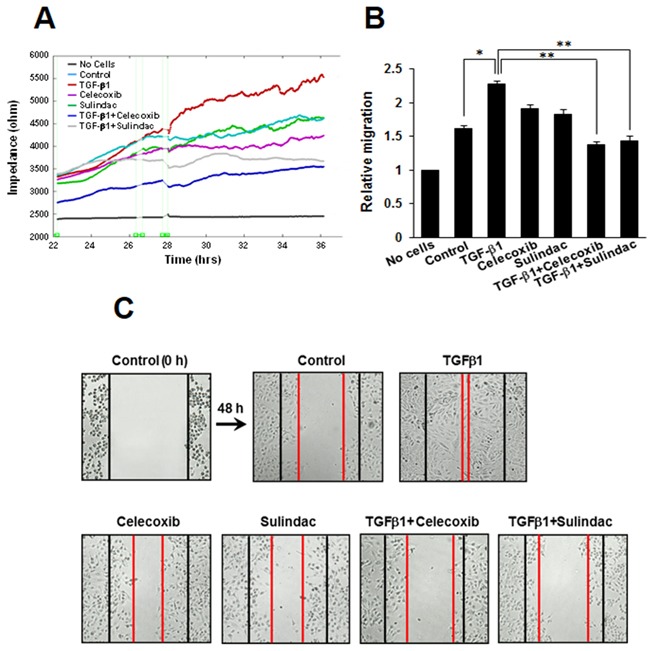
Figure 4. Effects of celecoxib and sulindac on transforming growth factor (TGF)-β1-induced A549 cell migration.

A. For the electric cell-substrate impedance sensing migration assay, A549 cells were stimulated with 5 ng/mL TGF-β1 for 2h and then incubated with 10 μM celecoxib or 500 μM sulindac for 48 h. Cell migration was then assessed by continuous resistance measurements for 40 h. B. The histogram represents the fold change in migration. The data represent the mean ± SD of three independent experiments. *p < 0.05 compared with the control, **p < 0.05 compared to the TGF-β1 group. C. Cell migration was also evaluated by wound healing assay. The confluent A549 monolayer was scratched with a pipette tip and washed to remove the debris. Fresh medium containing 0.5% serum was then added. Red lines indicate the cell edges at the T0 point. Representative pictures are shown.
