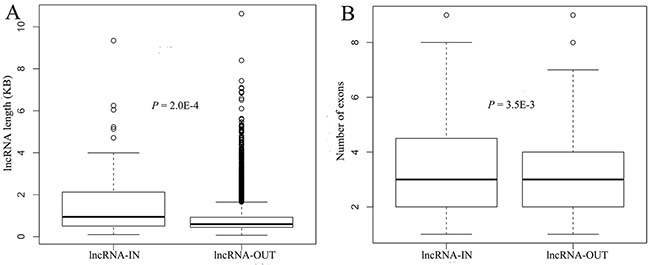
Figure 2. The properties of lncRNAs in ceRNA networks.

A. the boxplot depicted the length of lncRNAs in the ceRNA networks compared with lncRNAs not involved in the ceRNA networks. B. the boxplot depicted the number of lncRNA exons in the ceRNA networks compared with lncRNAs not involved in the ceRNA networks. P values were determined by the Mann-Whitney U test. The ‘lncRNA-IN’ represented lncRNAs in the ceRNA networks, and the ‘lncRNA-OUT’ represented lncRNAs that were not in the ceRNA networks.
