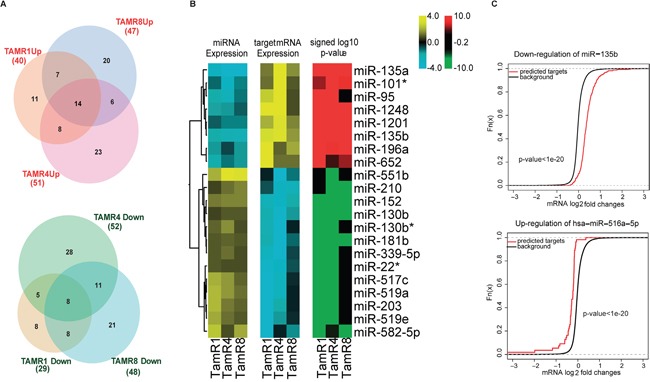
Figure 1. Inverse correlation analysis identified coherent direction of expression changes of miRNAs and their predicted functional targets.

A. Overlaps of differentially-expressed miRNAs in the three TamR vs. MCF-7/S0.5 cell lines, as measured by qPCR assays, are depicted in Venn Euler's diagrams. Circle size corresponds to the number of altered miRNAs in a given cell line. B. Heatmaps depict changes of expression common in all the TamR cells relative to MCF-7/S0.5. Log-fold changes of the miRNAs exhibiting altered expression in all resistant cell lines compared to MCF-7/S0.5 (14 upregulated and 8 downregulated) were plotted (panel 1 of the heatmap). Targets of these miRNAs identified using the inverse correlation analysis exhibited an opposite trend in the direction of the altered expression (panel 2), thereby displaying the effect of possible regulation by their miRNAs. C. The predicted functional targets of upregulated miRNAs were more downregulated than the non-targets (signed log10 p-values of the Wilcoxon rank-sum test.
