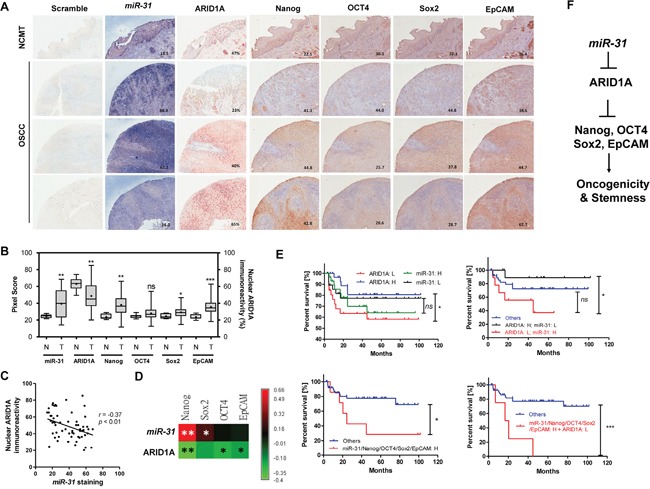
Figure 8. ISH and IHC analysis using HNSCC TMA tissue samples.

A. NCMT (Upper most) and 3 representative HNSCC TMA tissue cores. (x100). B. Quantification of miR-31, nuclear ARID1A, Nanog, OCT4, Sox2 and EpCAM immunoreactivities in NCMT and HNSCC tissue cores. C. An inverse correlation can be seen between miR-31 staining and nuclear ARID1A immunoreactivity. D. The algorithm of r values demonstrates a positive correlation between miR-31 staining and the expression of stemness factors together with an inverse correlation between ARID1A expression and the expression of stemness factors. E. Kaplan-Meier survival analysis used to assess the disease free survival of HNSCC patients. H, high expression; L, low expression. F. Illustration of miR-31-ARID1A-Nanog/OCT4/Sox2/EpCAM axis.
