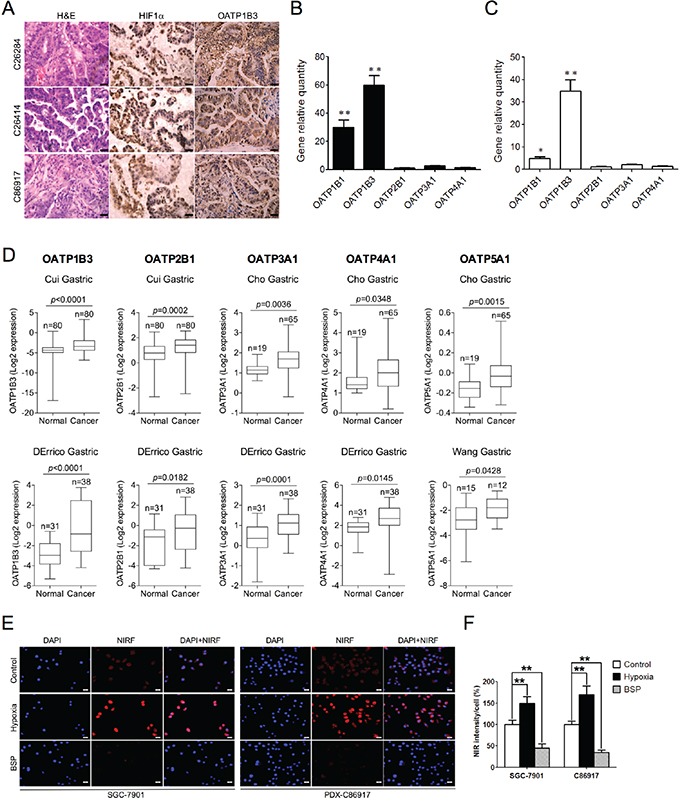
Figure 4. Mechanisms of NIRF dye uptake by gastric tumor cells and xenografts.

A. H&E and IHC analyses of HIF1α and OATP1B3 protein expression in gastric tumor tissues derived from 3 PDX models. Original magnification, ×400; scale bars represent 20 μm. B. qPCR analysis of select OATPs in PDX-derived tumor tissues. Data are presented as the fold change (mean ± SD, n=10) of gene expression in tumor tissues as compared to normal gastric tissues. **p<0.01. C. qPCR analysis of select OATPs in gastric cancer cells. Data are presented as the fold change (mean ± SD) of gene expression as compared to normal GES cells. **p<0.01. D. Oncomine analysis of select OATPs transcript levels in different gastric cancer data sets (normal vs. cancer). E. NIRF imaging of in vitro uptake of MHI-148 (5 μM, 10 min) by both SGC-7901 and PDX-derived C86917 cells under pre-treatment with either hypoxia (1% O2, 1 hr) or bromosulfophthalein (BSP) (250 μM, 1 hr). Representative images are shown. Scale bars represent 50 μm. F. Quantification of NIRF dye uptake in E. Intensity in control cells under normoxia and without treatment was set as 100% (mean ± SEM, n=5). **p<0.01.
