
Figure 2. Kaplan-Meier curves comparing OS and PFS among patients with and without a history of smoking.
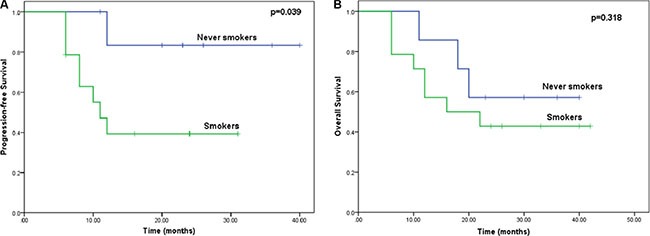
(A) Kaplan-Meier curves for PFS stratified based on tobacco smoking status (log-rank test: p = 0.039). (B) Kaplan-Meier curves for OS stratified based on tobacco smoking status (log-rank test: p = 0.318).