
Figure 3. Expression profile of the uPA, uPAR and SERPINE1 genes in head and neck samples from HNSCC patients included in TCGA database.
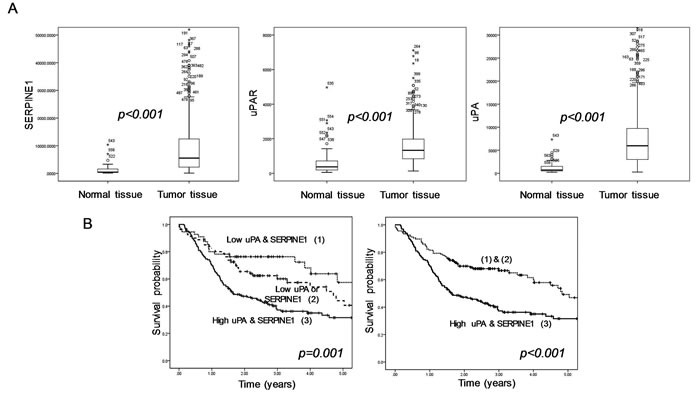
A. Differences in gene expression between normal tissue (n = 44) and tumor tissue (n = 520) (Mann Whitney U test). B. Differences in survival between patients with tumors expressing high levels of uPA or SERPINE1 and patients with low tumor expression (log-rank test and Kapplan Meier curves. In order to perform the survival analysis, we selected patients with a minimal follow-up of 18 months (n = 297). All (unpublished) results shown are based upon RNA seq level 3 data generated by TCGA Research Network;http://cancergenome.nih.gov/.