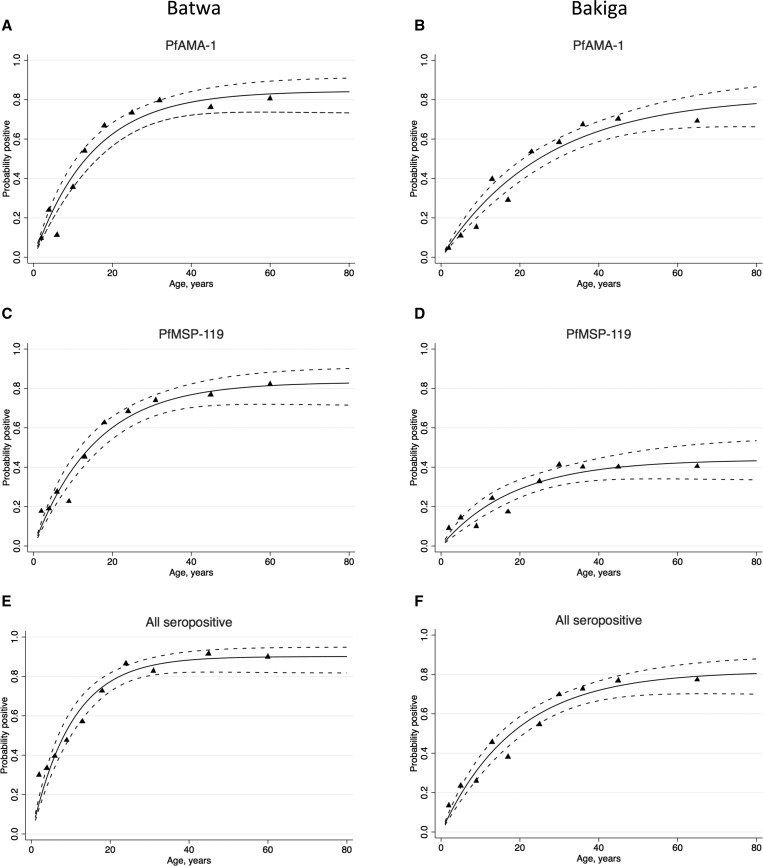
Figure 3.
Age–seroprevalence curves for anti–Plasmodium falciparum antibody responses corresponding to (A) Batwa AMA-1 and (B) Bakiga AMA-1 seropositive individuals; (C) Batwa MSP-119 and (D) Bakiga MSP-119 individuals; (E) all Batwa and (F) all Bakiga seropositive individuals in Kanungu District, Uganda, in 2014. Triangles represent observed data, and the dotted blue line represents the upper and lower 95% confidence intervals for the predicted seroprevalence curve. Seroconversion rates: (A) λ = 0.057, (B) λ = 0.031, (C) λ = 0.053, (D) λ = 0.024, (E) λ = 0.088, (F) λ = 0.044. AMA-1 = apical membrane antigen-1; MSP-119 = merozoite surface protein-119.

