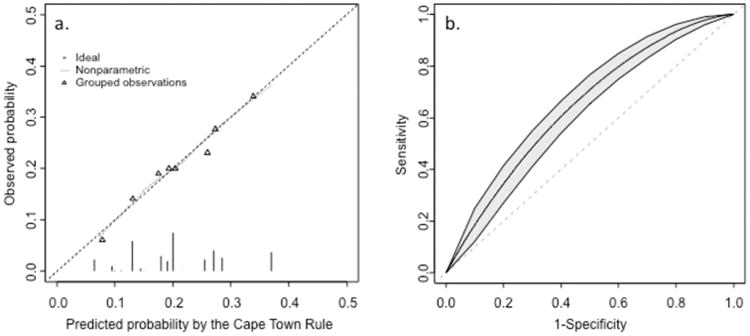
Figure 1.

(a) Calibration plot for the new Cape Town clinical decision rule. Triangles indicate the observed frequency of streptococcal pharyngitis per decile of increasing predicted probability of streptococcal pharyngitis by the Cape Town rule. The dotted line shows the relation between observed streptococcal pharyngitis and predicted streptococcal pharyngitis, from non-parametric methods. Ideally, this line equals the dashed line that represents perfect calibration. (b) Receiver-operating curve (ROC) for predicting group A streptococcal positivity in pharyngitis. The diagonal line represents zero discriminative value and corresponds to an AUC of 0.50. The three curves above the diagonal line are the ROC curve (middle line) and the lower and upper bounds of the 95% confidence interval around the ROC curves.
