
Fig. 1. Messenger RNAs for markers of type 2 and 3 inflammation were elevated in CRSsNP.
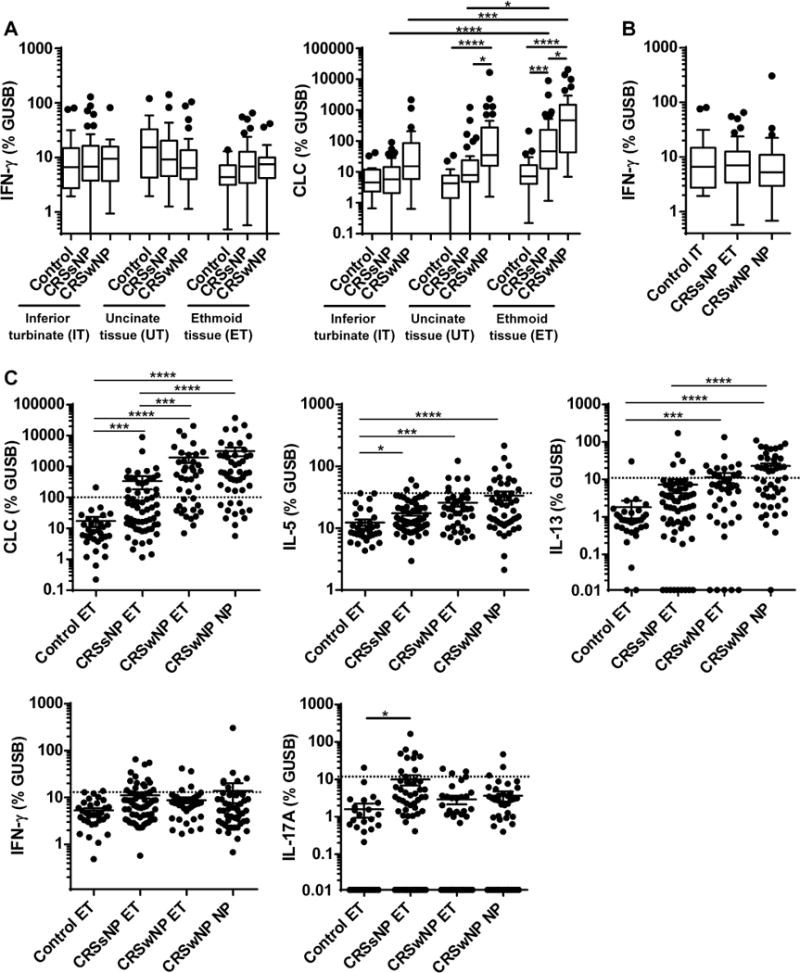
Total RNA was extracted from whole tissue of control IT (n=19), control UT (n=21), control ET (n=33), CRSsNP IT (n=53), CRSsNP UT (n=44), CRSsNP ET (n=61), CRSwNP IT (n=28), CRSwNP UT (n=29), CRSwNP ET (n=40) and CRSwNP NP (n=48). Expression of mRNAs for IFN-γ, CLC, IL-5, IL-13 and IL-17A was analyzed using real-time RT-PCR. Gene expression was normalized to a housekeeping gene, β-glucuronidase (GUSB), and expression levels were shown as % expression of GUSB. Results are shown as medians (25% to 75% interquartile ranges) (A, B) or mean ± SEM (C). Dotted line indicates the threshold based on the 95th percentile expression in control ET (CLC: 96.4, IL-5: 36.5, IL-13: 11.2, IFN-γ: 13.2, IL-17A: 12.1) (C). In order to display undetectable data, we plotted 0 as 0.01 in the log scaled figures (C). * p<0.05, ** p<0.01, *** p<0.001, **** p<0.0001, by one-way ANOVA.