Figure 5.
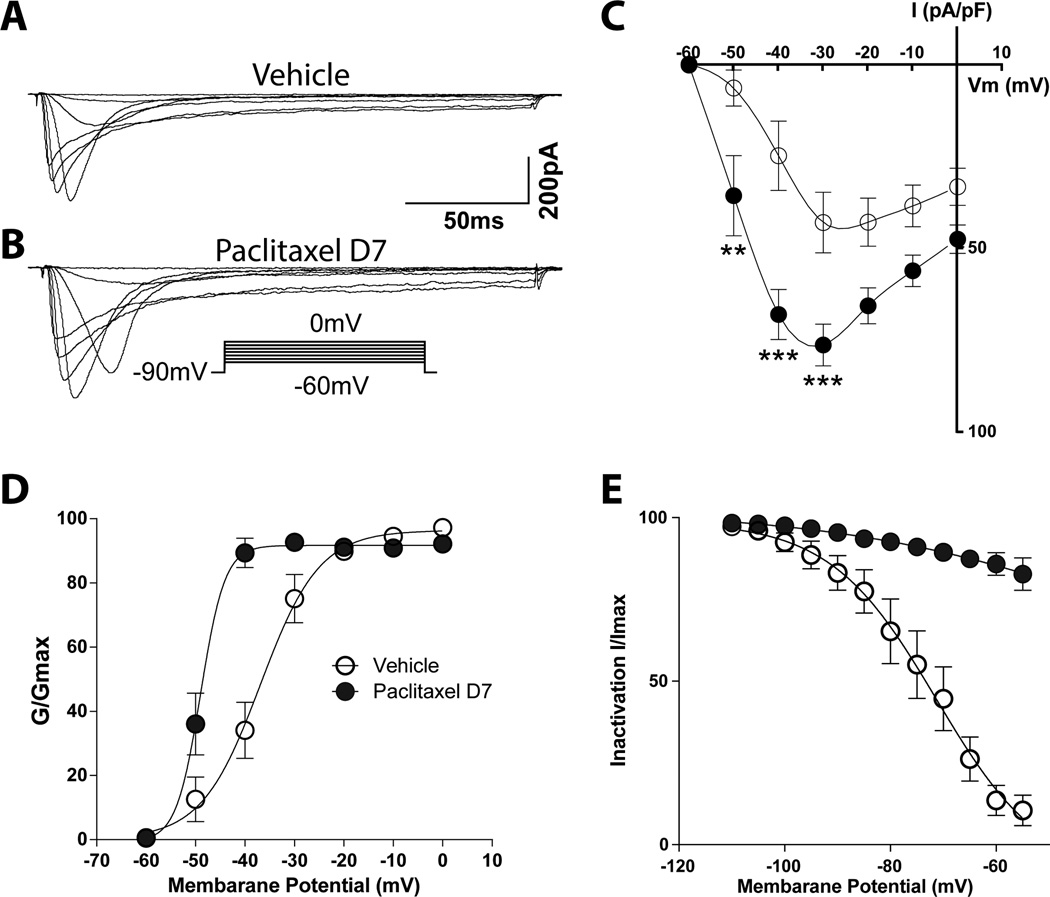
Upregulation of the T-type calcium current peak and density (pA/pF) in small DRG neurons following paclitaxel treatment. Traces representing T-type calcium current in the vehicle (A) and day 7 paclitaxel groups (B) evoked by command voltage steps from −90 mV (holding potential) to a test potential from −60 through 0 mV in 10-mV increments as shown in the insert. Scatter and line plots summarize the grouped data for current density (C) in the vehicle (open circles) and day 7- (filled black circles). The plots in D and E show the voltage-dependent activation and steady-state inactivation curves in the two groups. The curves in the day 7 paclitaxel group shifted to the left of those in the vehicle groups. The inactivation curve in the vehicle groups demonstrated acceleration at relative positive potentials, whereas this was not observed in the day 7 paclitaxel group. The stars indicate significant differences between the day 7 paclitaxel and vehicle groups. **p < 0.05; ***p < 0.001.

