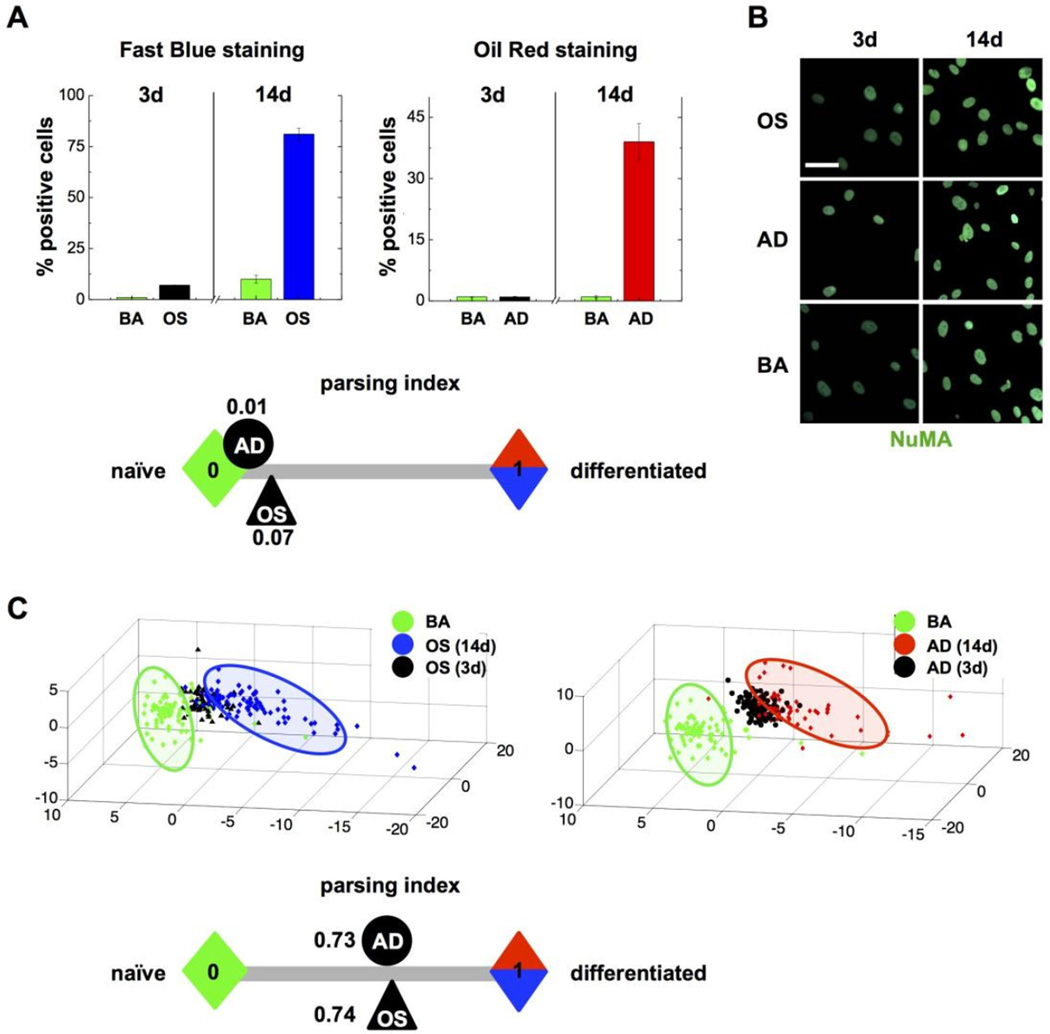
Figure 2. High-content analysis of nuclear descriptors identifies MSC lineage commitment.
(A) Proportion of MSCs stained positively with cytological dyes for osteogenesis (Fast Blue) and for adipogenesis (Oil Red) after 3 or 14 days in either osteogenic (OS), adipogenic (AD) or basal (BA) medium. (B) Representative confocal images of NuMA immunostaining in MSCs treated as in (A); scale bar, 25 µm. (C) High-content analysis of nuclear shape (from DAPI signals) and nuclear organization (NuMA texture descriptors) in MSCs treated with OS, AD, and BA media for 3 or 14 days. Parsing Indexes are calculated in (A) and (C) and schematically displayed to visualize the efficacy of the phenotypical assays at 3 days.

