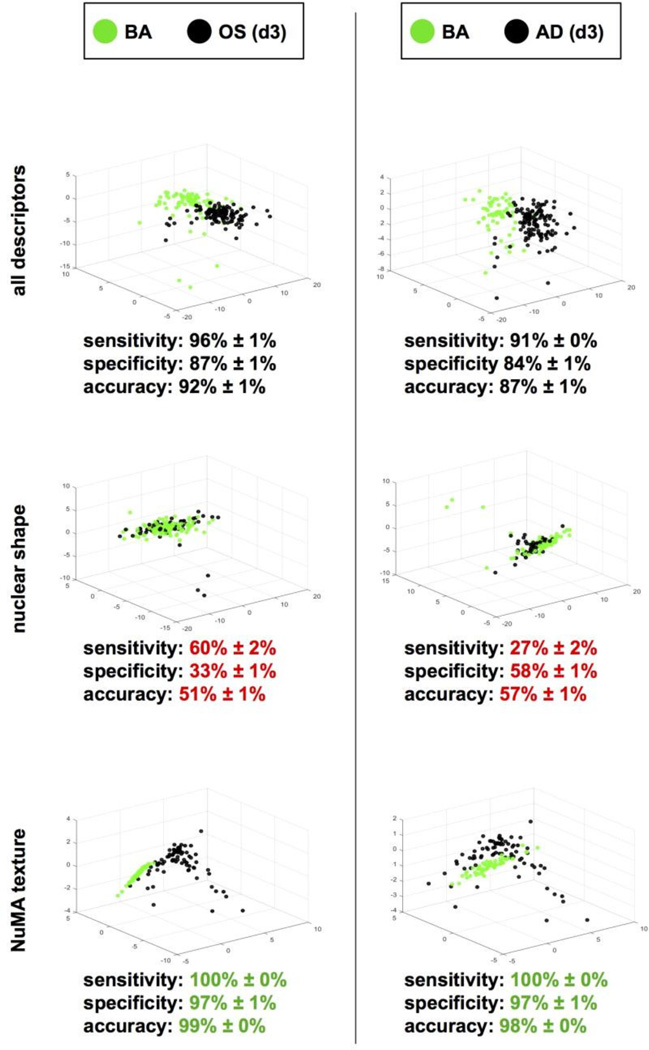
Figure 3. NuMA texture distinguishes MSC phenotypes.
High-content morphotextural analysis of nuclear descriptors in MSCs treated for 3 days with osteogenic (OS), adipogenic (AD) or basal (BA) medium. All descriptors (top panels) or subsets of descriptors corresponding to nuclear shape (DAPI; middle panels) and NuMA texture (bottom panels) were used for classification. Classifying metrics are shown. Red and green highlights identify worse and better classifications relative to the complete descriptor pool, respectively.

