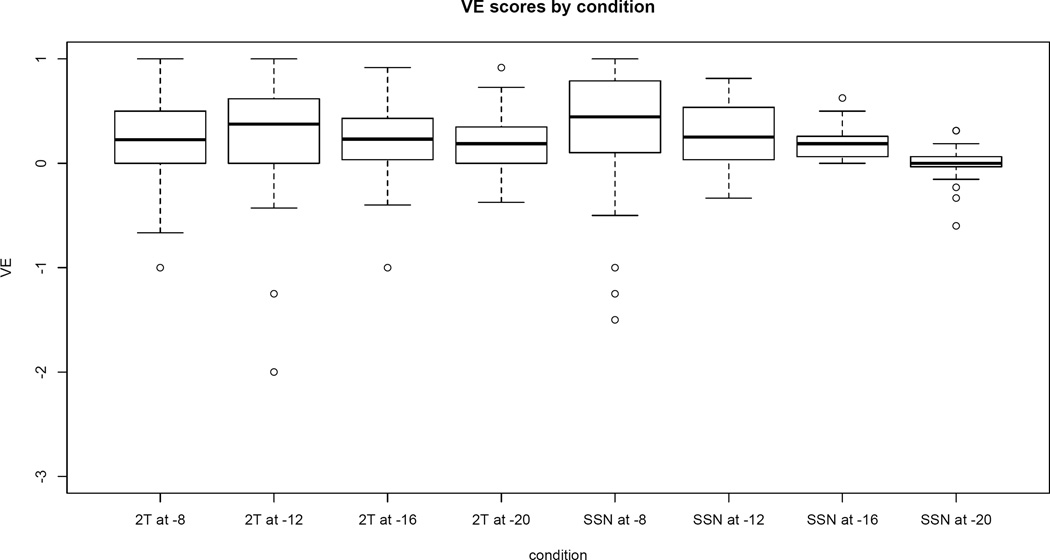
Figure 4.
VE scores by condition. The boxes extend from the 25th percentile to the 75th percentile, with the dark line indicating the median. Whiskers extend to data points that are within 1.5 times the interquartile range. Data outside that range is denoted by open circles. Note that one outlier is not displayed. (A VE score of −7 on SSN at −8 dB)

