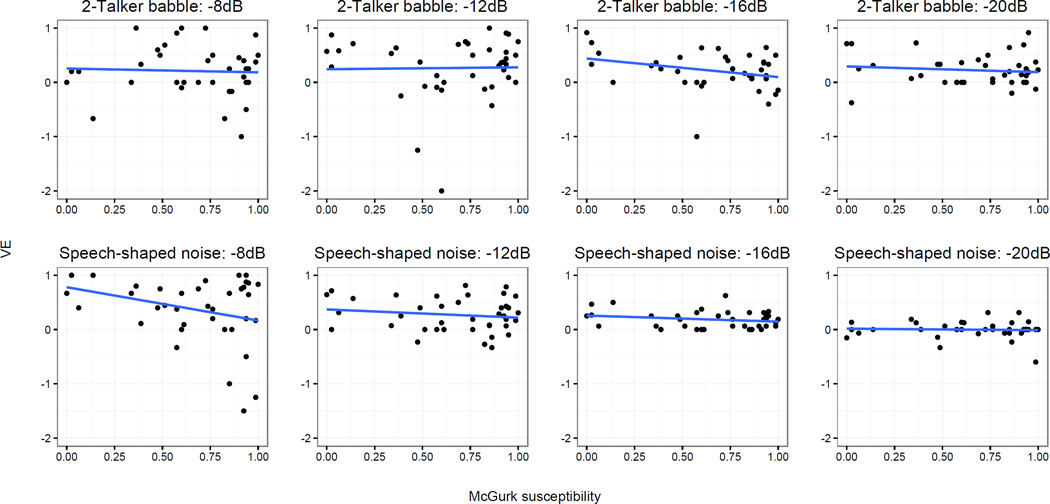
Figure 5.
Visual enhancement plotted against McGurk susceptibility for each listening condition. Top row: 2-talker babble conditions. Bottom row: Speech-shaped noise conditions. Linear trendlines are included, with shading to represent standard error. For the sake of axis consistency, one data point for SSN −8dB is not displayed, although it is included in the calculation of the trendline (McGurk score=.86; VE score =−7).

