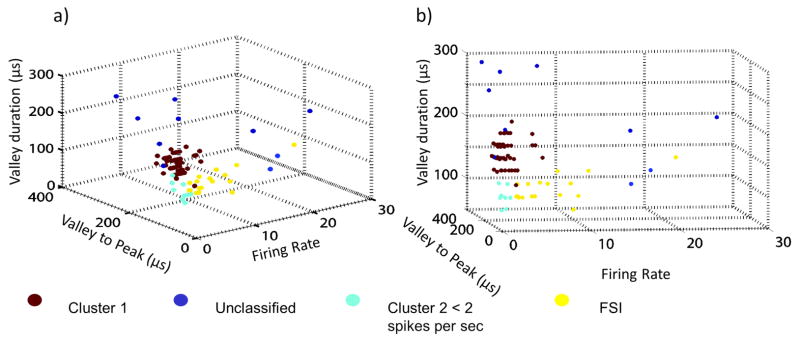
Figure 2.
a) & (b) three-dimensional scatter plots of entire distribution of recorded waveforms along the three dimensions used in cluster analysis: FR, valley duration, valley to peak duration from two perspectives. Yellow dots: 17 neurons classified as FSIs (with FR> 2 spikes/sec), dark red dots: neurons classified as MSNs. Remaining neurons belong to minor clusters.

