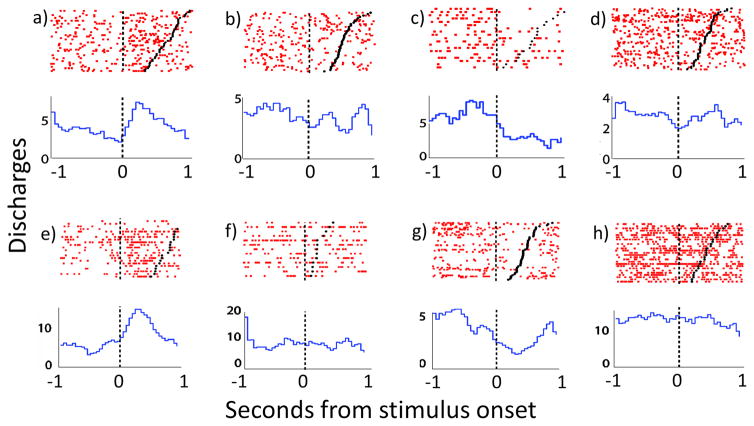
Figure 3.
Rasters and peri-event time histograms (PETHs) centered on the onset of body part stimulation (represented by black vertical dashed line at time 0) displaying firing of body part responsive FSIs. Black dots represent the offset of body part stimulation. (a) raster-PETH displaying firing of a responsive FSI that exhibits clear increase in firing during downward passive head movement, (b) lack of modulation for same neuron during upward head movement. (c) Another FSI exhibits clear decrease related to upward paw movement, but (d) a lack of modulation during upward head movement. e) FSI showing increased FR during upward head movement, (f) and no modulation during whisker stimulation. (g) Another FSI showing large decrease in FR during upward head movement, (h) but no change during left paw lifts.

