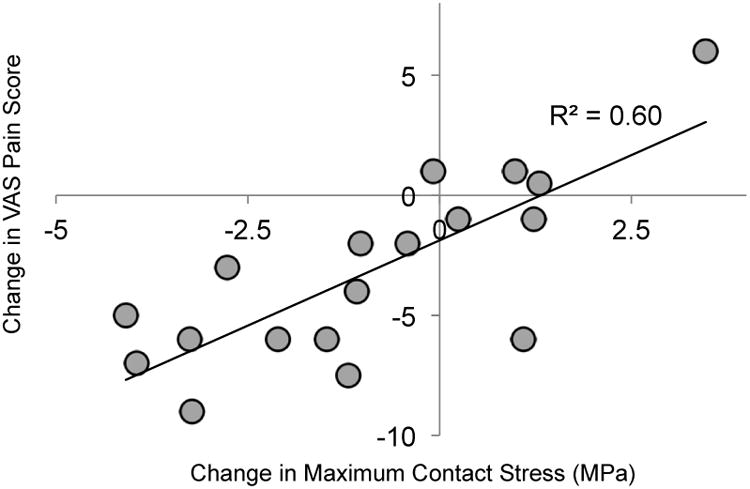
Figure 5.

Plot of changes in visual analog scale (VAS) pain score (post-op – pre-op) vs. change in maximum contact stress. VAS pain scores range from 0 to 10, with higher scores indicating more pain. Lower contact stress values were computed in patients who experienced less pain.
