Fig. 1.

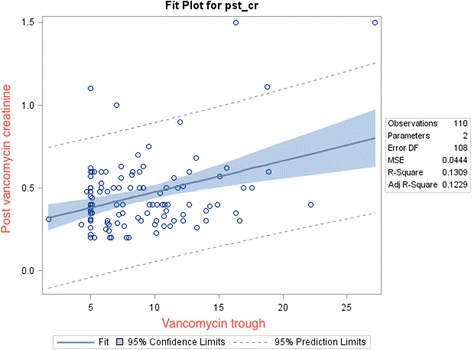
Showing a Fit plot between vancomycin trough concentrations and post vancomycin creatinine. The plot depicts a positive co-relation between the two parameters

Showing a Fit plot between vancomycin trough concentrations and post vancomycin creatinine. The plot depicts a positive co-relation between the two parameters