
Fig. 2.
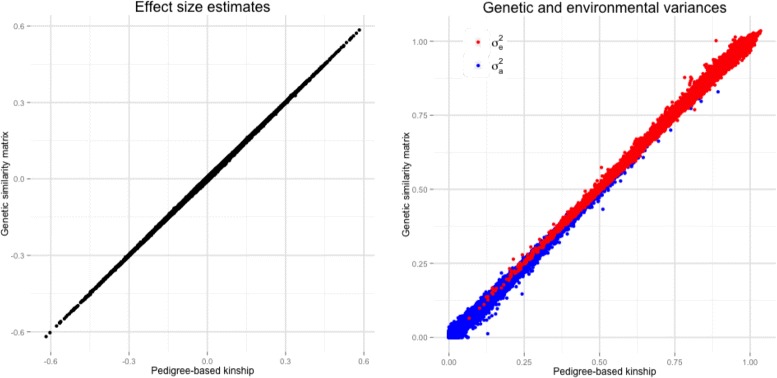
Trascriptome-wide Association Study in UK Twins. Comparison of the results obtained in the transcriptome-wide association when the relatedness between subjects was evaluated using the family structures and when it was inferred from genome-wide SNPs by means of LDAK [12]. Left panel effect size estimates for the association between gene expression levels and BMI. Right panel estimated genetic (, in blue) and environmental (, in red) variances