Fig. 7.

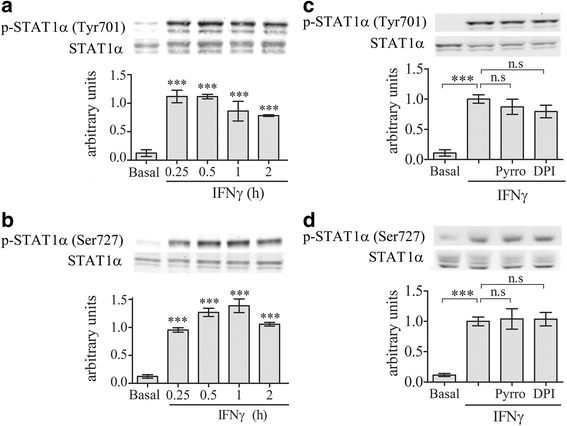
cPLA2α or NADPH oxidase did not affect STAT1α activation under IFNγ stimulation. A representative immunoblot analysis of the kinetics of STAT1α phosphorylation on (a) tyrosine 701 or (b) serine 727 induced by 10 ng/ml IFNγ. A representative immunoblot analysis of STAT1α phosphorylation on (c) tyrosine 701 or on (d) serine 727 in unstimulated or stimulated BV-2 microglia by 10 ng/ml IFNγ for 15 min in the absence or presence of 2 μm pyrrophenone (Pyrro) or 5 μm DPI (added to the cells 60 min before stimulation). The intensity of each phosphorylated STAT1α (p-STAT1α) band was quantitated as described in Fig. 4. The Bar graphs are the mean ± SE from three experiments (***p < 0.0001, n.s. not significant)
