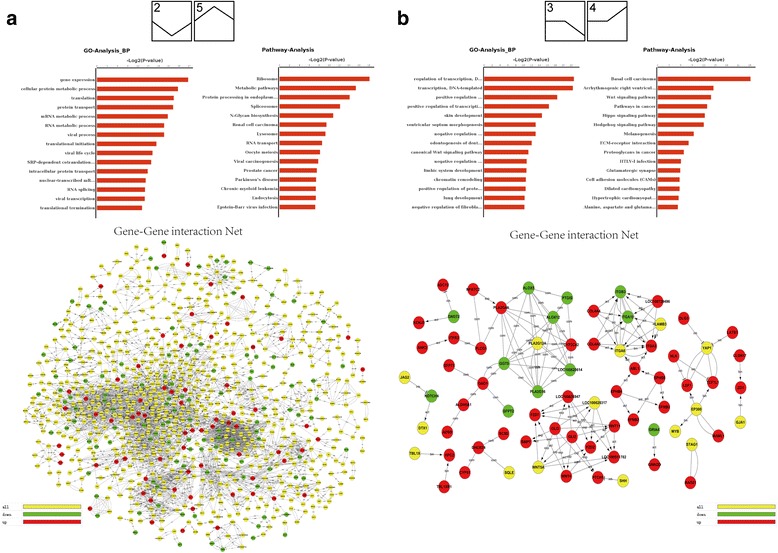
Fig. 6.

Analysis of gene expression trends from RNA-Seq. a The top 15 GO terms, top 15 pathways and gene-interaction net analysis from profiles 2 and 5 show that many genes and pathways are enriched from both profiles. b The top 15 GO terms, top 15 pathways and gene-interaction net analysis from profiles 3 and 4 suggest that both WNT and TGF-β signalling pathways are involved in both trends
