Fig. 3.

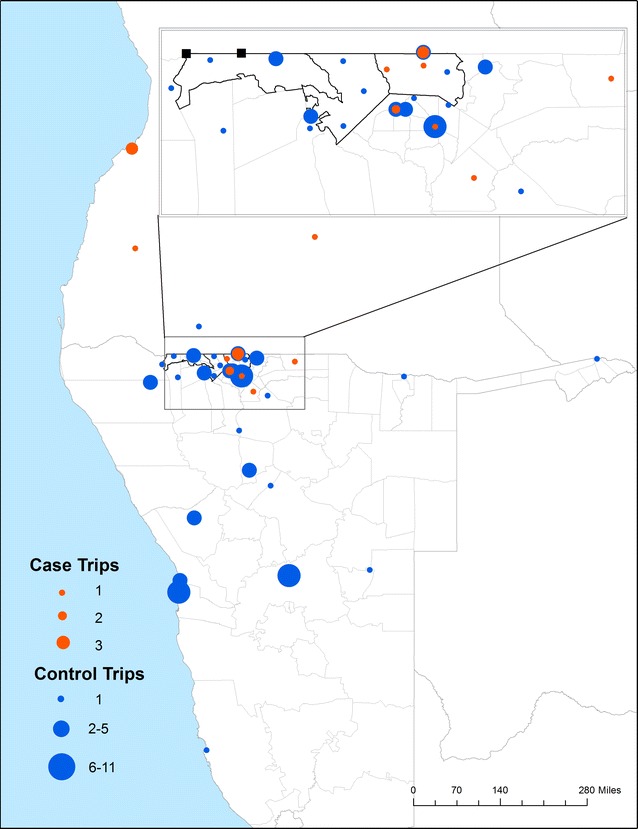
Travel destinations of 84 geolocated trips, where the color and size of the dots denote the number of cases (orange) or controls (blue) that travelled to that location

Travel destinations of 84 geolocated trips, where the color and size of the dots denote the number of cases (orange) or controls (blue) that travelled to that location