
Fig. 1.
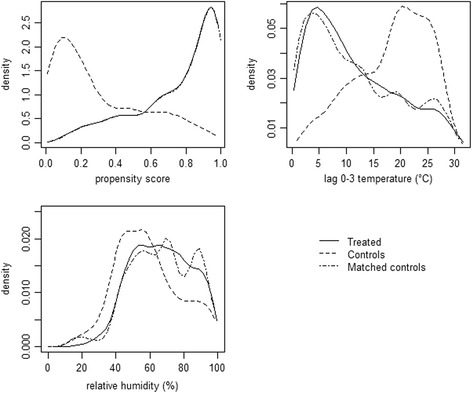
Density functions of estimated propensity score, average temperature in the current and in the previous three days (lag 0–3) and relative humidity for treated days, control days and matched control days, Milan, Italy, 2003–2006. Note that for propensity score the treated and matched curves are completely overlapping