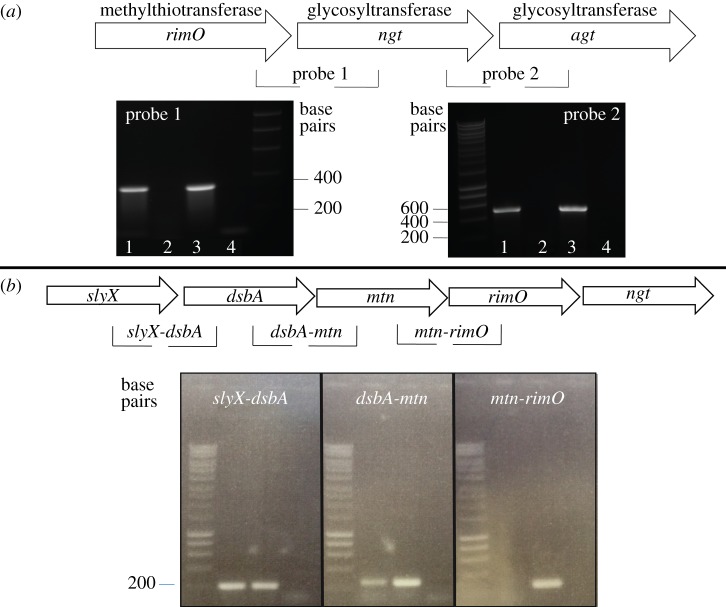
Figure 3.
(a) Transcriptional analysis of the A. pleuropneumoniae NGT locus. Lane 1: cDNA as template; lane 2: RNA as template; lane 3: A. pleuropneumoniae HS143 genomic DNA positive control; lane 4: negative PCR control (no template). (b) Transcriptional analysis of the region upstream of ngt. Lane 1: cDNA as template; lane 2: genomic DNA positive control; lane 3: PCR control (RNA as template).

