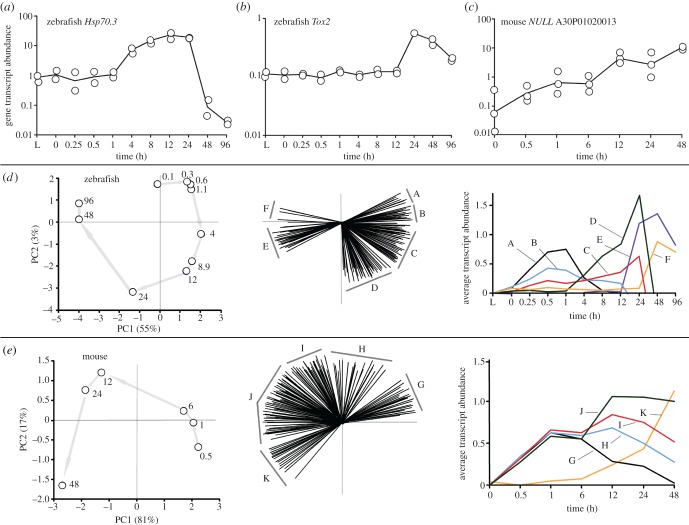
Figure 1.
Transcriptional profiles of representative genes (arb. units), ordination plots based on transcript abundances by postmortem time (h) with corresponding transcript contributions (biplots), and averaged transcript abundances by group. (a–c) Transcriptional profiles of (a) the Hsp70.3 gene, (b) the Tox2 gene and (c) a non-annotated transcript ‘NULL’ (i.e. no annotation, probe number shown) gene as a function of postmortem time. (d,e) Ordination plots of the (d) zebrafish and (e) mouse were based on all gene transcript profiles found to have a significantly increased abundance. Gene transcripts in the biplots were arbitrarily assigned alphabetical groups based on their positions in the ordination. The average transcript abundances for each group are shown.

