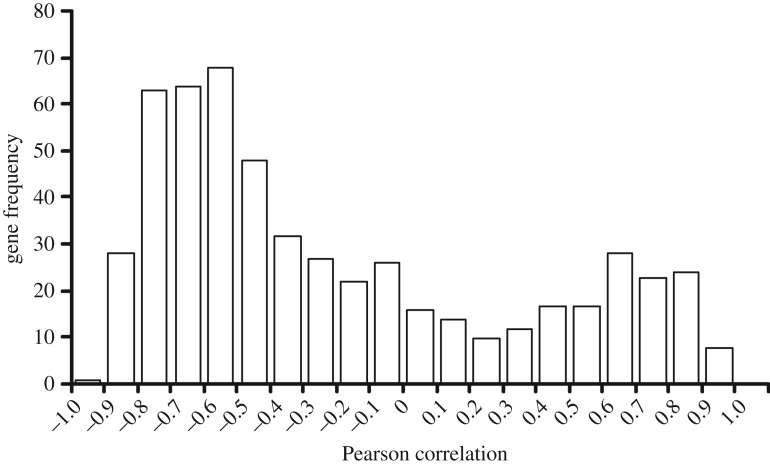
Figure 13.
Distribution of the correlations of the expected fold change and relative gene transcript abundance by postmortem time for the zebrafish. We only considered probes targeting gene transcripts that significantly increased with postmortem time relative to the live controls (n = 548). Correlations above 0.685 were significant at α = 0.01 and indicate the possibility of enrichment of the stable cRNA.

