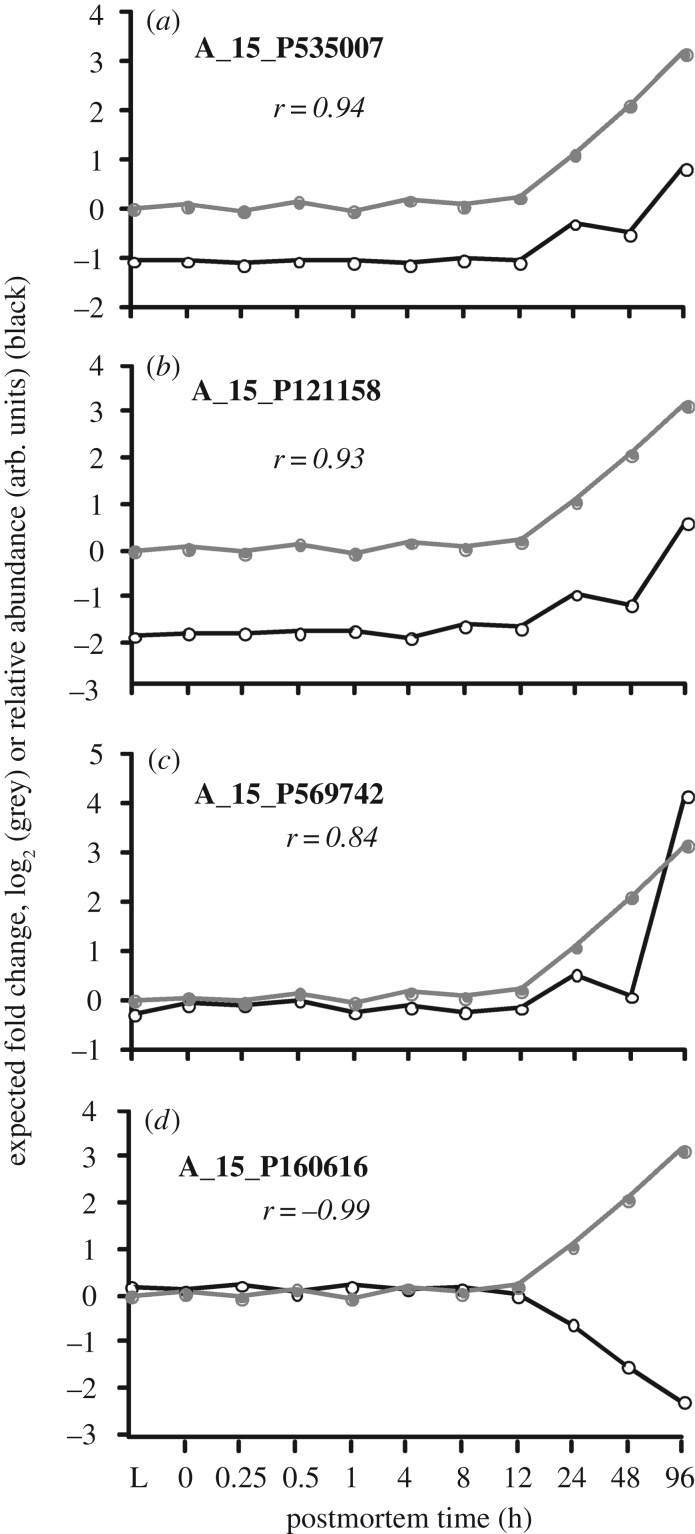
Figure 14.
Comparison of expected fold change (grey) based on total cRNA extracted relative to live control versus specific gene transcript profiles (black) by postmortem time. (a–c) Relative transcript abundances that are highly correlated with expected fold change and are therefore putatively enriched and/or stable. (d) A transcript profile that is negatively correlated with expected fold change and therefore neither enriched nor stable.

