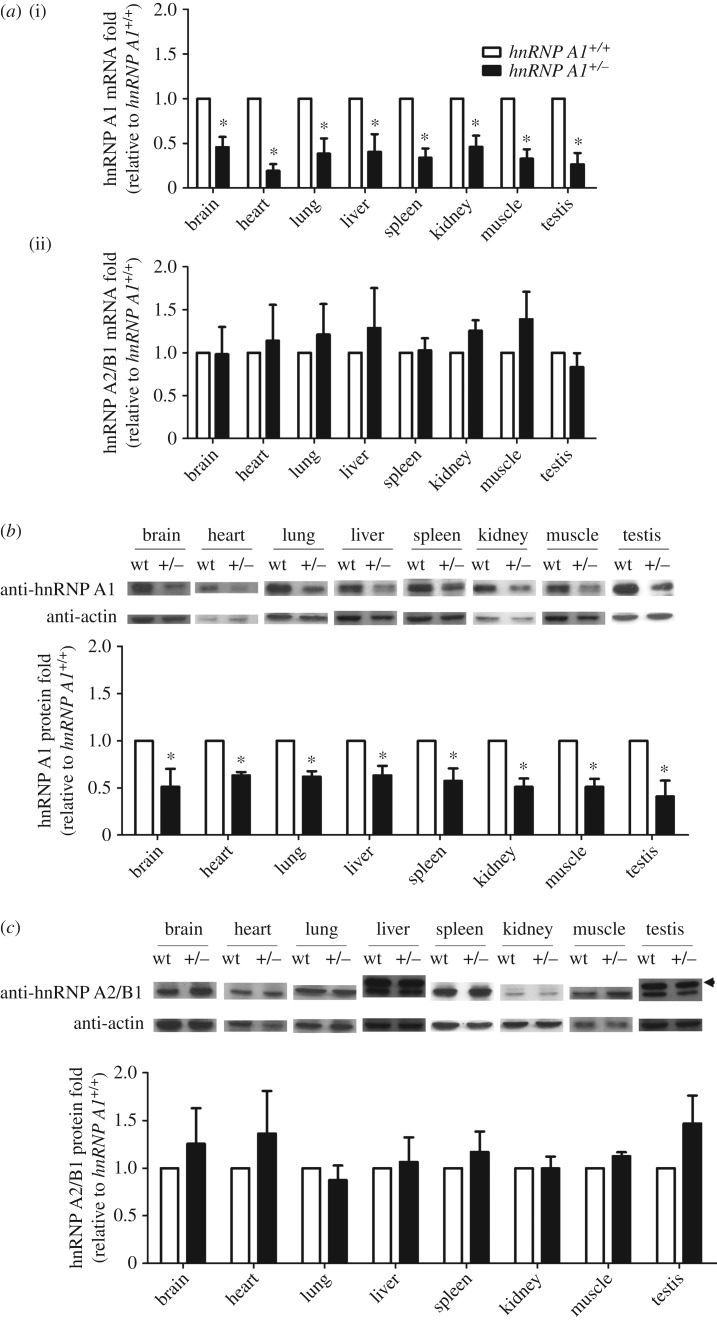
Figure 6.
hnRNP A2/B1 did not compensate for the expression of hnRNP A1. (a) Total RNA of different tissues isolated and subjected to qRT-PCR to detect mRNA levels of hnRNP A1 (i) and hnRNP A2/B1 (ii) in 18- to 20-week-old mice. The fold change was standardized using gapdh mRNA levels. Protein levels of (b) hnRNP A1 and (c) hnRNP A2/B1 (36/38 kDa) detected using western blotting. The arrowhead indicates hnRNP A2 (38 kDa). The fold change was standardized using β-actin protein levels. Error bars represent standard deviation. *p < 0.05 compared with the wild-type mice. The results are summarized from observations of nine mice.

