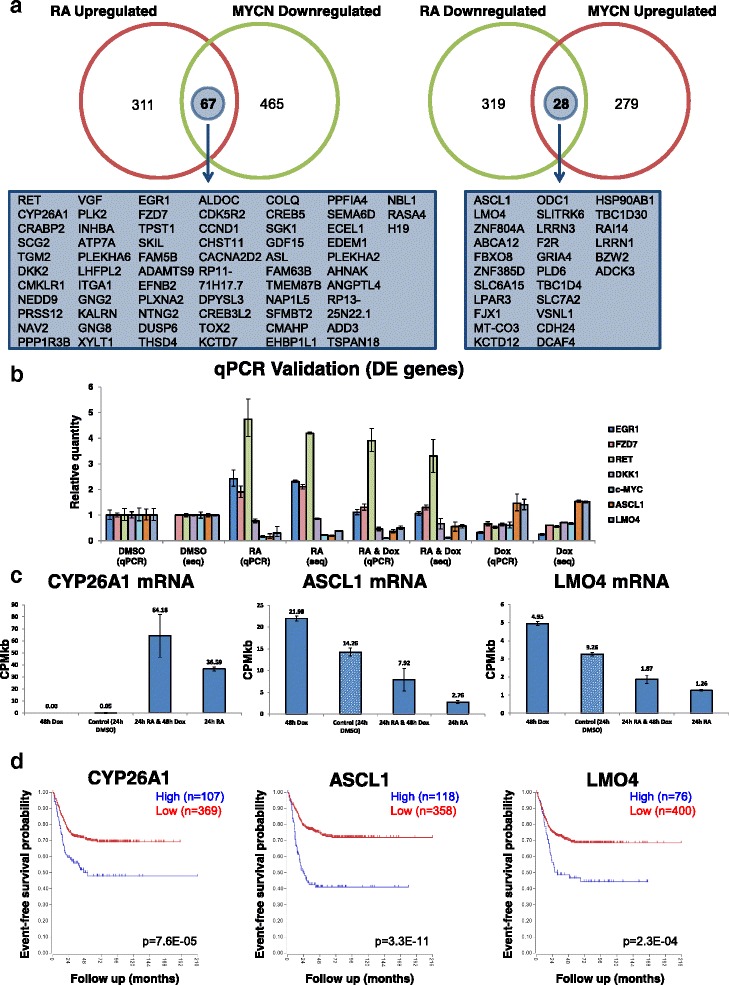
Fig. 2.

Likely drivers of the MYCN-mediated differentiation block: genes regulated in opposing directions by RA treatment and MYCN overexpression. a Number and overlap of the 169 differentially expressed genes (compared with control transcriptome) altered in opposing directions between the RA and MYCN overexpression treatments. Left: Overlap of genes upregulated by RA (24 h) and downregulated by MYCN overexpression (48 h). Right: Overlap of genes upregulated by MYCN overexpression (48 h) and downregulated by RA (24 h). The names of the genes which were common between the treatments but differentially expressed in opposing directions are shown below each Venn diagram. Venn diagrams were generated using Venny (http://bioinfogp.cnb.csic.es/tools/venny/index.html). b RT-qPCR validation in SY5Y-MYCN cells of the RNA-seq for a panel of differentially expressed genes, EGR1, FZD7, RET, DKK1,c-MYC, ASCL1 and LMO4. Levels of expression for each gene are set relative to those in untreated samples of control cells. RT-qPCR time-points mirror the RNA-seq time-points. RT-qPCR samples denoted by “qPCR“ with their RNA-seq counterparts denoted by “seq”. Error bars for qPCR samples denote RQ Min and RQ Max, while for RNA-seq samples they are standard deviation. c Levels of absolute gene expression for CYP26A1 (left), ASCL1 (centre) and LMO4 (right), in each of the SY5Y-MYCN RNA-seq treatments. Expression is in read counts per million adjusted by gene length in kilobases (CPMkb), with error bars denoting the standard deviation between replicates. d Kaplan–Meier survival curves showing the predictive strength of the expression levels of the CYP26A1 (left), ASCL1 (centre) and LMO4 (right) mRNAs in neuroblastoma tumours on patient outcome. Generated using the Kocak [69] 649 neuroblastoma tumour dataset in the R2: Genomics Analysis and Visualization Platform (http://r2.amc.nl)
