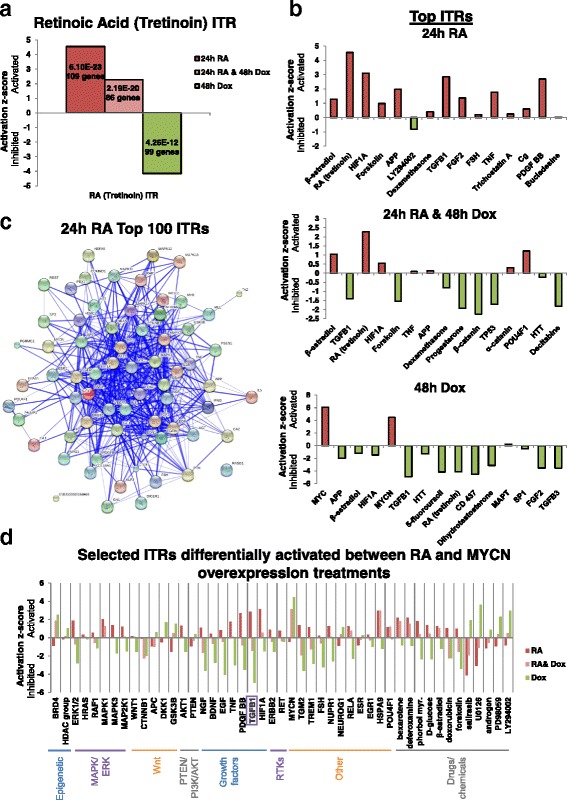
Fig. 4.

RA and MYCN overexpression drive opposing activation dynamics of their downstream transcriptional regulators. a Activation/inhibition score of the RA inferred transcriptional regulator (ITR) in SY5Y-MYCN cells across the treatment groups. These values are generated, using IPA, from the SY5Y-MYCN RNA-seq data. Activation/inhibition values are relative to the RA activity levels of the SY5Y-MYCN control cells. The total number of DE genes used to call the differential activity of the ITR and the p value of overlap are shown within each bar. b Top 15 ITRs (ranked by p value of overlap) from the SY5Y-MYCN RNA-seq data for each of the treatment groups compared with the DMSO vehicle control, as generated by IPA analysis. c Protein–protein interaction map of the top 100 ITRs governing the genes differentially expressed between the 24-h 1-μM RA and 24-h DMSO vehicle control treatments in SY5Y-MYCN cells. The protein interaction map of previously known connections between these proteins was generated with the String database. Note that only protein ITRs are shown; miRNAs and drug compounds are excluded. d Activation/inhibition scores of selected ITRs which were differentially activated between the RA and MYCN overexpression treatments. The scores were generated, using IPA, from the SY5Y-MYCN RNA-seq data. Activation/inhibition values are relative to the ITR activity levels of the SY5Y-MYCN control cells
