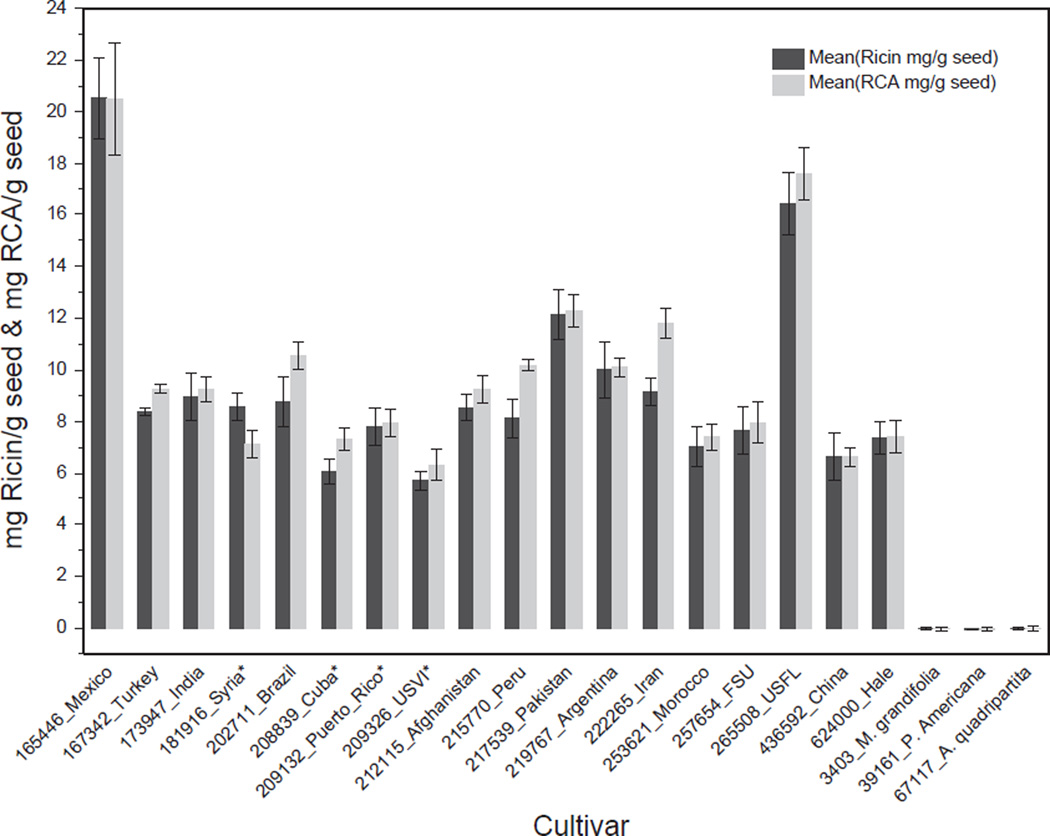
Fig. 2.
Measurement of the quantity of ricin and RCA in individual cultivars in mg/g of seed as determined by isotope dilution mass spectrometry. Dark gray denotes quantity of ricin calculated from the mean of the A-chain peptides VGLPINQR and LTTGADVR, light gray denotes quantity of RCA calculated from the mean of the A-chain peptides VGLPISQR and SHLTTGGDVR. The y-axis is the quantity of ricin or RCA in mg/g seed. Asterisk denotes small seed cultivars. Each value represents the mean of three replicates; error bars show one standard deviation from the mean.

