
Figure 1. MAP-2B and GFAP immunostaining in 6, 9, 12 DIV HN and HNG cultures.
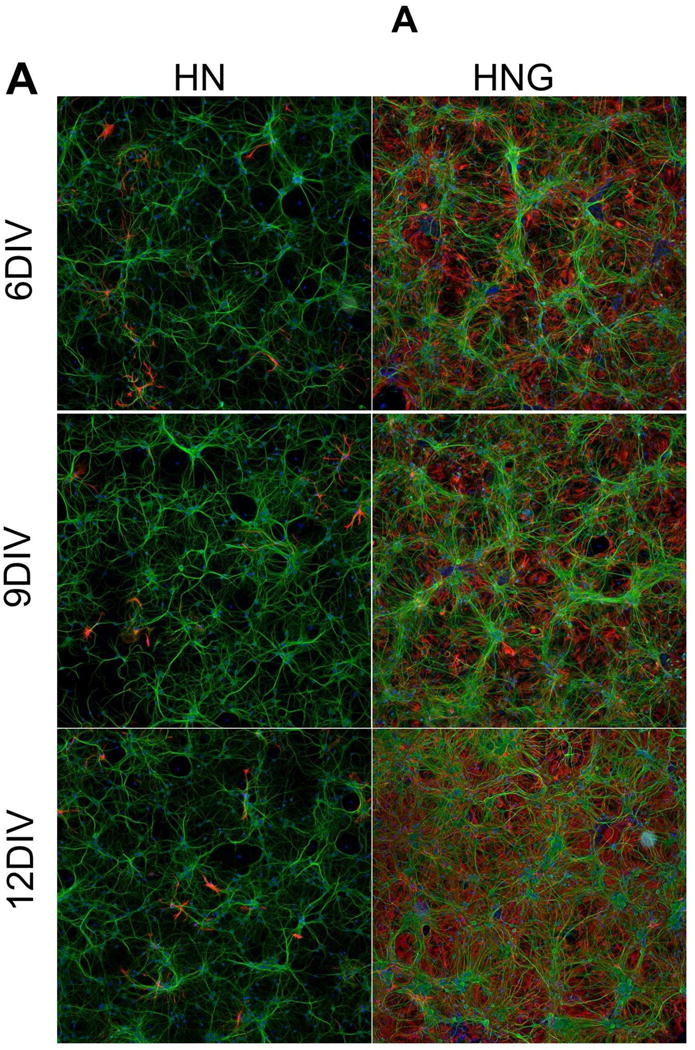
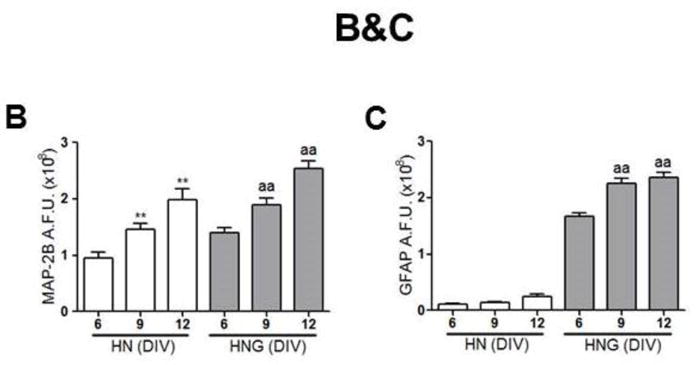
(A) Representative MAP-2B and GFAP staining pictures in 6, 9, 12 DIV hippocampal neurons in the presence (HN, left panel) and absence (HNG, right panel) of ARA-C post exposure; (B) Quantification of the MAP-2B fluorescence intensity in 6, 9, 12 DIV HN and HNG cultures; (C) Quantification of the GFAP fluorescence intensity in 6, 9, 12 DIV HN and HNG cultures. Each data point represents Mean±SEM from two independent experiments performed in triplicates. **, p<0.01, vs. 6 DIV HN; aa, p<0.01, vs. 6 DIV HNG. Green, MAP-2B; Red, GFAP; Blue; Hoechst-33342.