
Figure 2. SCOs patterns in HN and HNG cultures at different ages.
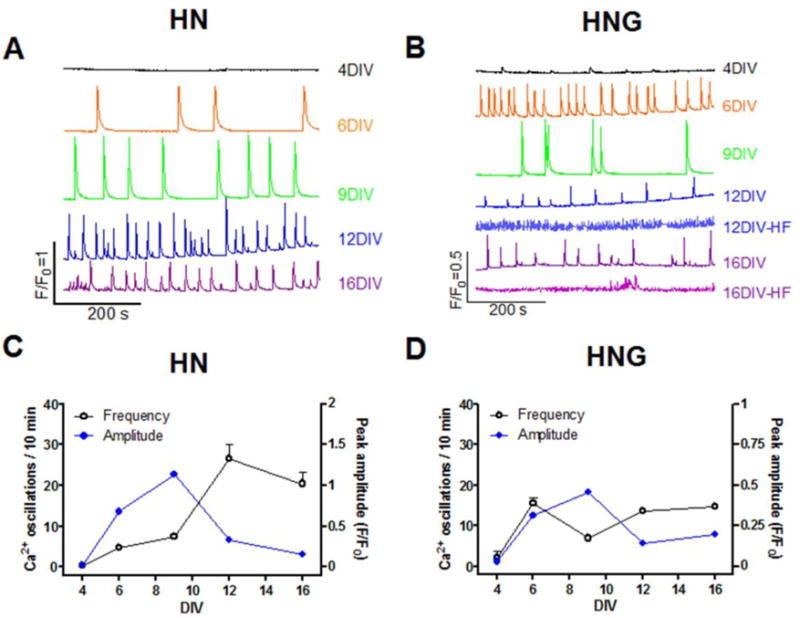
Representative traces of SCOs in HN (A) and HNG (B) at different ages; Quantification of SCO frequency and amplitude in different ages of HN (C) and HNG (D). Each data point of frequency represents Mean±SEM from at least three independent cultures performed in five replicates and each data point of amplitude represents Mean±SEM of all the SCO events from three independent cultures performed in five replicates. It should be noted that although five batches of HNG cultures displayed consistent developmental patterns of SCOs until 9 DIV, 2 out of 5 cultures displayed a very high frequency (HF) low amplitude events commencing greater than 12 DIV. Since the amplitude of SCOs from these traces was smaller than 0.1 units (ΔF/F0), we didn’t quantify the frequency and amplitude of these high frequent SCOs.