
Figure 4. Expression levels of GABAA receptor γ2 and α5 subunits in 4, 6, 9, 12 and 16 DIV cultures.
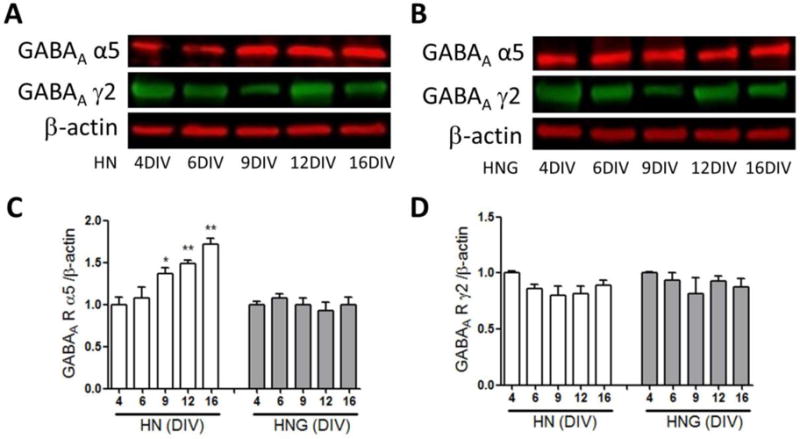
Representative western blot for GABAA receptors γ2 and α5 subunits expressions in 4, 6, 9, 12 and 16 DIV HN (A) and HNG (B) cultures; Quantification of the GABAA receptor α5 (C) and GABAA receptor γ2 (D) subunits expression levels in 4, 6, 9, 12 and 16 DIV cultures. Each data point represents the Mean±SEM (n=4) pooled from two independent cultures. *, p<0.05, **, p<0.01, vs. 4 DIV HN culture.