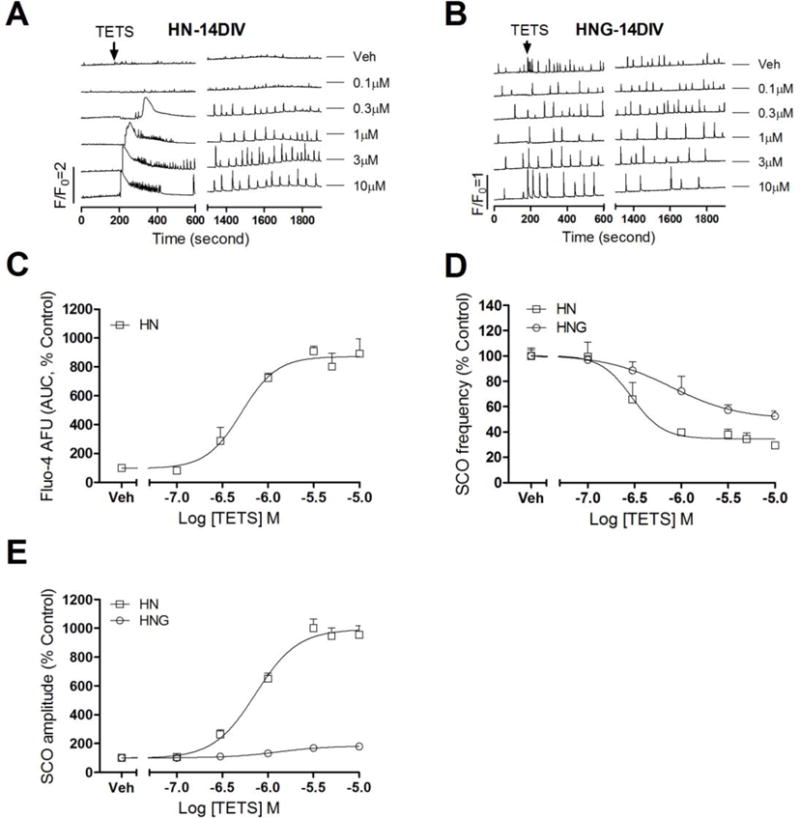
Figure 7. TETS response on SCO in HNG and HN cultures at 14 DIV.

Representative traces of TETS response on SCOs as a function of time in HN (A) and HNG (B) cultures at 14 DIV. In addition to delayed increased SCO amplitude and decreased SCO frequency (Phase II response), TETS produced an immediate intracellular Ca2+ rising (Phase I response) in 14 DIV HN; (C) Concentration-response relationships for TETS-induced intracellular Ca2+ rising calculated as Fluo-4 fluorescence area under the curve (AUC); The AUC was calculated in a period of 10 min after TETS addition; (D) Concentration-response relationships for TETS decreased SCO frequency in 14 DIV HNG and HN cultures; (E) Concentration-response relationships for TETS increased SCO amplitude in 14 DIV HNG and HN cultures. This experiment was repeated in three independent cultures, each with four replicates.
