
Figure 2.
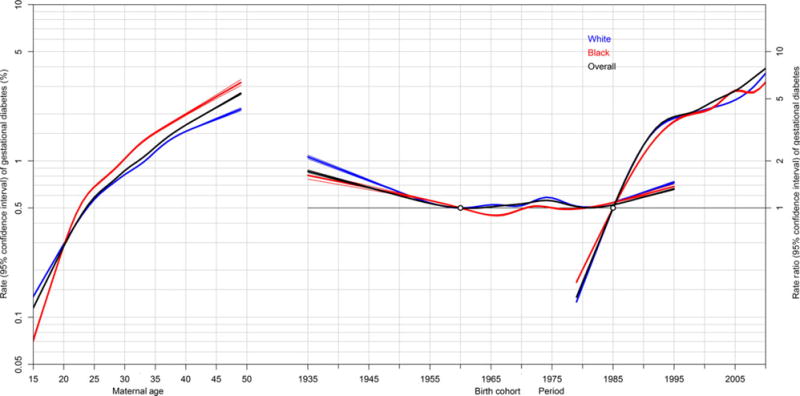
Age–period–cohort effects on gestational diabetes mellitus (GDM) in the US, 1979–2010. Rates with 95% confidence intervals are shown on the left vertical axis for maternal age, and risk ratios with 95% confidence intervals are shown on the right vertical axis for period (1980 as the reference period) and maternal birth cohort (1965 as the reference cohort); USA, 1979–2010. Rates of GDM by maternal age are adjusted for period and birth cohorts, and risk ratios for period and maternal birth cohort effects are adjusted for the other two factors.