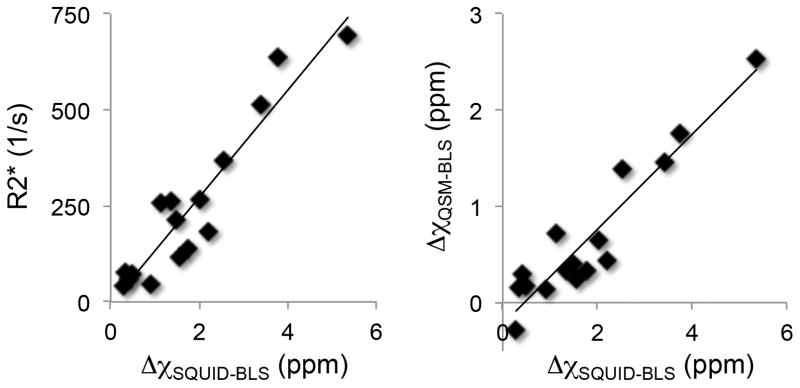
Figure 3.
Scatterplots of R2* versus SQUID-BLS (left) and QSM-BLS versus SQUID-BLS (right) demonstrate strong correlations between both MRI-based measures of liver iron and SQUID-BLS. The coefficient of determination between R2* and SQUID-BLS was r2 = 0.88. Linear regression between the two BLS methods demonstrated the following relationship: QSM-BLS = (−0.22 ± 0.11) + (0.49 ± 0.05) · SQUID-BLS, with r2 = 0.88.

