
Figure 4.
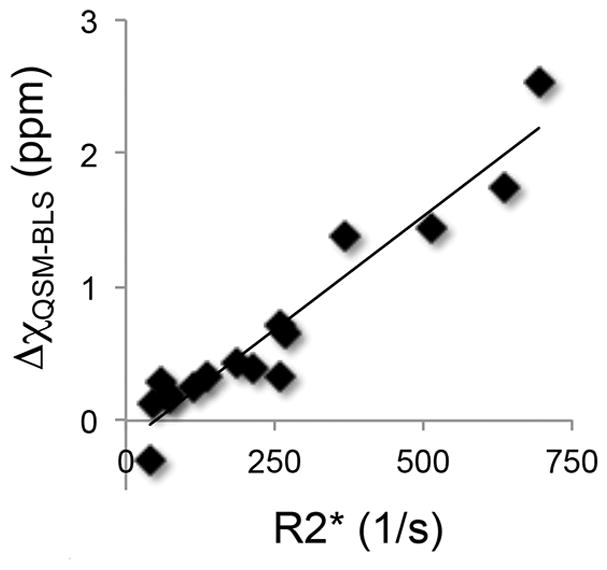
QSM-BLS demonstrates strong correlation to R2*. The linear regression analysis between these two MR-based measures of LIC yielded: QSM-BLS = (−0.17 ± 0.09) + (0.0034 ± 0.0003) · R2*, with r2 = 0.92.
Official websites use .gov
A
.gov website belongs to an official
government organization in the United States.
Secure .gov websites use HTTPS
A lock (
) or https:// means you've safely
connected to the .gov website. Share sensitive
information only on official, secure websites.
QSM-BLS demonstrates strong correlation to R2*. The linear regression analysis between these two MR-based measures of LIC yielded: QSM-BLS = (−0.17 ± 0.09) + (0.0034 ± 0.0003) · R2*, with r2 = 0.92.